
Advait Energy Transitions Limited


Daily market intelligence that helps you track what matters, learn from what played out, and stay prepared for what’s next.

Popular articles


Comprehensive Investment Analysis: Advait Energy Transitions Limited
Complete Report with Validated Data | February 13, 2026
Advait Energy Transitions Limited (NSE: ADVAIT, BSE: 543230) is an Ahmedabad-based company operating in power transmission infrastructure and rapidly transitioning into renewable energy solutions, particularly green hydrogen technology. Founded in 2009 and listed on BSE, the company has executed over 450 projects across 45+ countries and reported consolidated revenue of ₹486.33 crore in 9M FY26, up 138% YoY.
Current Price (Feb 13, 2026): ₹1,662
Market Capitalization: ₹1,899 crore
52-Week Performance: Stock up significantly but with high volatility
1. BUSINESS OVERVIEW & MARKET POTENTIAL
Core Business Activities
Advait operates through three primary business verticals:
A. Power Transmission & Substation Solutions (Core Business – ~70% Revenue)
• Stringing tools and equipment for transmission lines
• ACS (Aluminum Clad Steel) wire manufacturing
• OPGW (Optical Ground Wire) operations and fiber networks
• Emergency Restoration Systems (ERS)
• Live-line installation services (completed over 10,000 km of live-line projects globally)
• Turnkey EPC solutions for power utilities
B. Telecommunication Infrastructure (~15% Revenue)
• Turnkey telecom tower projects
• OPGW/OFS manufacturing through JV with TG China
• Fiber optic network deployment
C. Green Energy Transition (Launched 2023 – Rapidly Growing ~15% Revenue)
• Alkaline and PEM electrolyser systems (120 MW/year capacity in Kadi, Gujarat, expanding to 200 MW/year)
• Fuel cell systems (partnership with TECO 2030 AS from Norway)
• Hydrogen refueling stations (HRS)
• Battery Energy Storage Systems (BESS)
• Solar EPC projects (contributed ₹71.56 lakh in Q3 FY26)
• Carbon credit consultancy and sustainability services
Industry & Sub-Sectors
• Electrical Equipment & Power Transmission (primary)
• Renewable Energy Infrastructure (emerging high-growth segment)
• Green Hydrogen Ecosystem (nascent but strategic)
• Telecommunication Infrastructure (supporting)
Total Addressable Market (TAM)
Power Transmission Market
India's power transmission network requires massive expansion to support the target of 500 GW renewable energy capacity by 2030. The government's focus on grid modernization and interstate transmission corridors creates a multi-billion dollar opportunity. The Union Budget 2026's focus on energy security and grid strengthening provides strong long-term tailwinds.
Green Hydrogen Market
India's National Green Hydrogen Mission targets 5 MMT annual production by 2030. With electrolyser capacity being set up at 120 MW/year (expandable to 200 MW/year), Advait is positioned in a market expected to grow at 50%+ CAGR through 2030. The PLI scheme provides additional support for domestic manufacturing.
BESS & Solar EPC
Every renewable tender now includes storage requirements, creating exponential demand for battery storage systems. The BOO (Build-Own-Operate) model provides recurring revenue opportunities.
Estimated TAM
• Power Transmission Infrastructure: $15–20 billion annually in India
• Green Hydrogen Equipment: $5–8 billion by 2030 in India
• BESS Market: $10–15 billion by 2030 in India
Industry Life Cycle Stage
• Power Transmission: Mature but with ongoing modernization (steady 8–12% growth)
• Green Hydrogen & BESS: Emerging stage with high growth potential (50%+ CAGR) but execution risks
• Overall Assessment: Transitioning from mature to emerging high-growth segments
2. MARKET POSITIONING
Market Share & Competitive Standing
Advait holds a niche position in specialized segments:
• One of few companies globally to complete 10,000+ km of live-line installations
• Early mover in domestic electrolyser manufacturing under PLI scheme
• Estimated <5% market share in overall power transmission equipment
• Stronger positioning in specialized tools and ERS systems (estimated 15–20% market share in niche)
Order Book Strength: ₹1,048 crore as of Dec 31, 2025 (+132% YoY), providing strong revenue visibility. Power transmission solutions contribute 84% of order book, while new & renewable energy accounts for 16%.
Recent Major Win: Secured largest-ever EPC order of ₹216 crore from PGVCL for reconductoring of 11 kV distribution lines.
Competitive Landscape
Key competitors in power transmission equipment:
• Dynamic Cables Limited (Market Cap: ₹1,975 Cr, P/E: 47.54x)
• Aimtron Electronics Limited (Market Cap: ₹1,886 Cr, P/E: 72.87x)
• IKIO Technologies Limited (Market Cap: ₹1,228 Cr, P/E: 39.71x)
• Paramount Communications Limited (Market Cap: ₹1,199 Cr, P/E: 13.78x)
In green hydrogen equipment:
• Ohmium International
• Reliance Industries
• Larsen & Toubro
• John Cockerill
Brand Strength & Pricing Power
• Moderate brand recognition in B2B power transmission segment
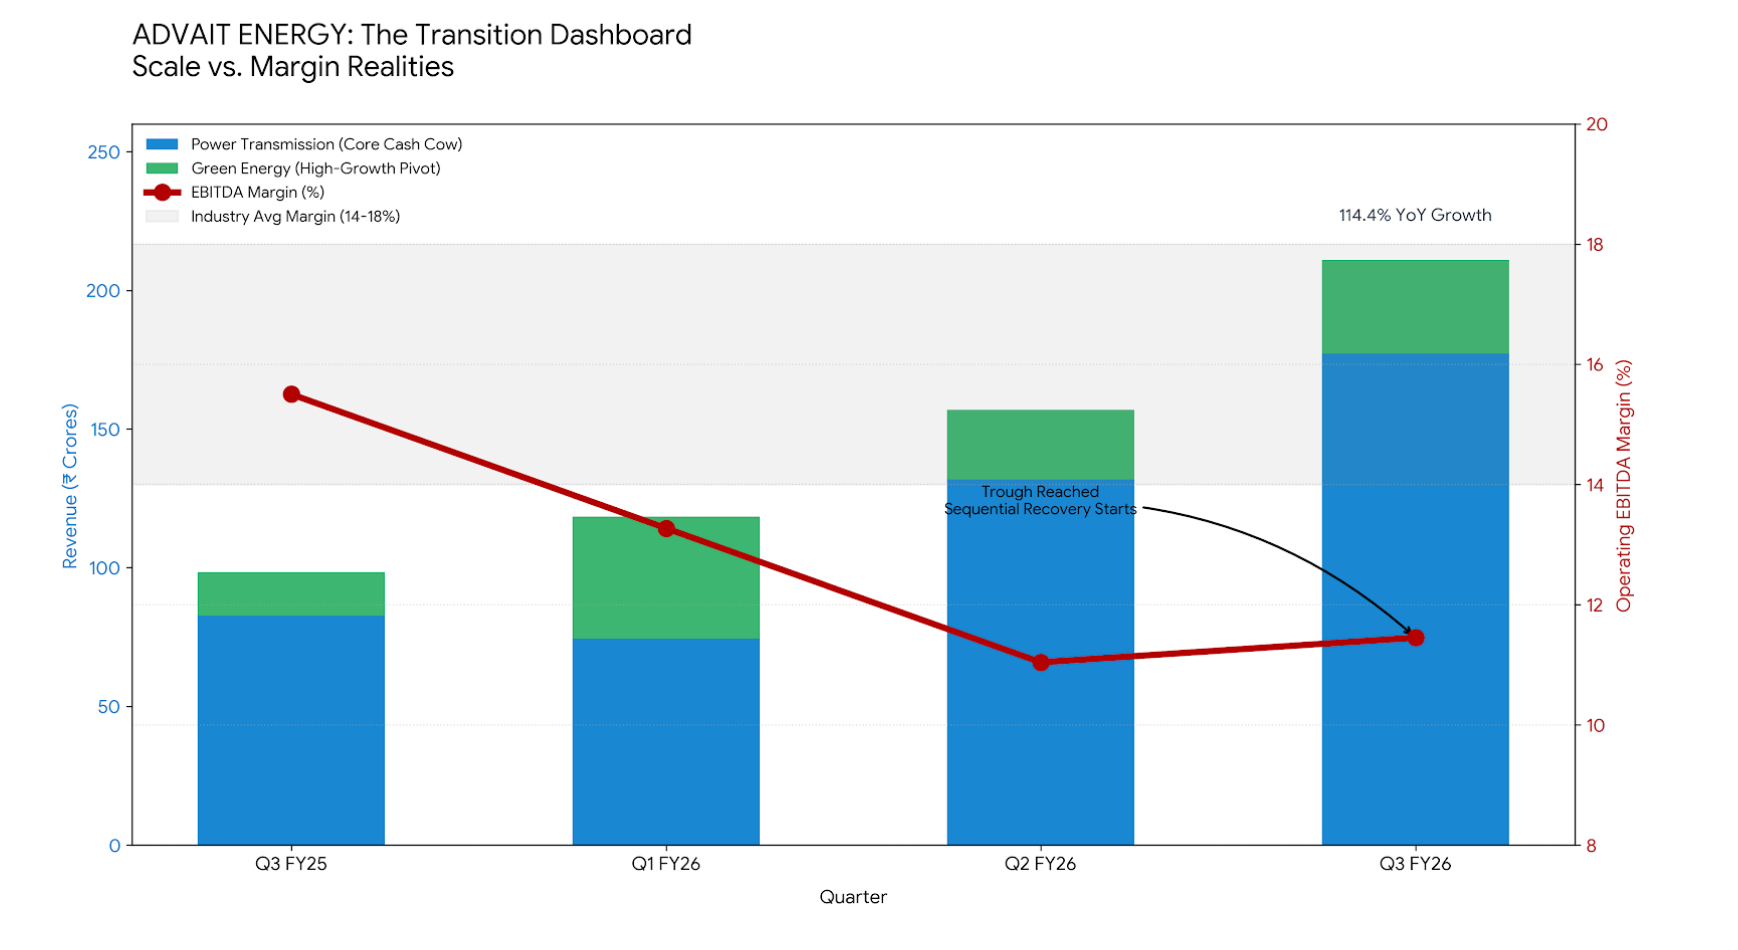
• Limited pricing power evidenced by operating margin compression from 15.50% (Q3 FY25) to 11.45% (Q3 FY26) despite 114% revenue growth
• However: Sequential margin recovery visible – net margin improved from 6.48% (Q2 FY26) to 8.24% (Q3 FY26), suggesting potential stabilization
• Emerging differentiation in green hydrogen equipment manufacturing
3. BUSINESS MOATS
Identified Competitive Advantages
1. Technical Expertise in Live-Line Installations
• Rating: 7/10
• Justification: Specialized capability achieved by handful of companies globally; high entry barriers due to safety requirements, extensive training, and international certifications
• Durability: High – capability built over 15+ years
• Uniqueness: Medium-High – few competitors globally
2. First-Mover Advantage in Domestic Green Hydrogen Manufacturing
• Rating: 6/10
• Justification: Among early Indian companies with operational electrolyser facility under PLI scheme; technology partnerships with TECO 2030 (fuel cells) and CENmat (electrolysers) provide technological edge
• Durability: Medium – advantage lasts 2–3 years until larger players scale up
• Uniqueness: Medium – Reliance and L&T entering but Advait has head start
3. Integrated End-to-End Solution Portfolio
• Rating: 5/10
• Justification: Ability to provide complete solutions from transmission tools to OPGW to green hydrogen creates customer stickiness and cross-selling opportunities
• Durability: Medium – competitors can replicate through partnerships
• Uniqueness: Low-Medium – not deeply differentiated
4. Strategic Technology Partnerships & JVs
• Rating: 6/10
• Justification: JV with TG China for OPGW, partnership with TECO 2030 for fuel cells (4.89% stake acquired), and multiple MoUs for electrolyser technology provide access to cutting-edge technology without full R&D investment
• Durability: Medium – dependent on partner relationships
• Uniqueness: Medium – partnerships themselves are valuable
5. Geographic Execution Capability
• Rating: 5/10
• Justification: Presence in 45+ countries demonstrates execution capability and risk management in diverse environments
• Durability: Low-Medium – operational capability but not a moat
• Uniqueness: Low – many competitors operate internationally
6. Strong Order Book Providing Revenue Visibility
• Rating: 6/10
• Justification: ₹1,048 crore order book (132% YoY growth) provides 12–15 months of revenue visibility
• Durability: Medium – order book needs continuous replenishment
• Uniqueness: Medium – reflects strong execution and customer relationships
4. MOAT RATING & OVERALL SCORE
Moat Category | Rating (1–10) | Durability | Uniqueness | Strategic Value
Technical Expertise (Live-Line) | 7 | High | Medium-High | High
Green Hydrogen First-Mover | 6 | Medium | Medium | Very High
Integrated Portfolio | 5 | Medium | Low-Medium | Medium
Strategic Partnerships | 6 | Medium | Medium | High
Geographic Presence | 5 | Low-Medium | Low | Medium
Order Book Strength | 6 | Medium | Medium | High
Overall Competitive Advantage Score: 5.8/10
Assessment: Advait possesses moderate competitive advantages primarily in specialized technical services and early positioning in green hydrogen. The strategic pivot into high-growth segments could strengthen moats if execution succeeds, but current advantages are not deeply entrenched. The concerning margin compression (operating margin from 15.5% to 11.45% YoY) despite strong revenue growth indicates limited pricing power. However, the sequential quarterly improvement (net margin from 6.48% in Q2 to 8.24% in Q3 FY26) suggests potential stabilization.
Key Risk: Large players like Reliance and L&T entering green hydrogen with significantly deeper pockets could erode Advait's first-mover advantage within 2–3 years.
5. RECENT QUARTERLY PERFORMANCE

Q3 FY26 Performance (Oct–Dec 2025) – Latest Quarter
Revenue Growth
• Consolidated Revenue: ₹211.03 crore (+114.4% YoY vs ₹98.41 crore in Q3 FY25)
• Sequential Growth: +34.5% QoQ vs ₹156.87 crore in Q2 FY26
• Seventh consecutive quarter of positive sales growth
Profitability
• Net Profit (Consolidated): ₹17.39 crore (+77.7% YoY vs ₹9.79 crore)
• Net Profit Margin: 8.24% (vs 9.95% in Q3 FY25)
• Operating Margin (EBITDA): 11.45% (down from 15.50% in Q3 FY25, but improved from Q2 FY26)
• Operating Profit (PBDIT): ₹24.16 crore – highest quarterly figure on record
Key Observations
• Exceptional revenue acceleration – 114% YoY growth demonstrates strong execution
• Sequential QoQ margin recovery – improvement from 6.48% (Q2) to 8.24% (Q3) net margin suggests potential stabilization
• YoY margin compression remains concerning – Operating margin declined 404 bps
• Stock rallied post-results, followed by minor correction by Feb 13
Margin Analysis – YoY Compression vs QoQ Recovery
Metric | Q3 FY25 | Q2 FY26 | Q3 FY26 | YoY Change | QoQ Change
Revenue | ₹98.4 Cr | ₹156.9 Cr | ₹211.0 Cr | +114.4% | +34.5%
Operating Margin | 15.50% | ~11.04% | 11.45% | -404 bps | +41 bps
Net Margin | 9.95% | 6.48% | 8.24% | -171 bps | +176 bps
Critical Insight: While YoY margin compression is concerning, the strong QoQ recovery suggests the worst may be behind. Q4 FY26 results will be critical to confirm if margin stabilization is sustainable.
Q2 FY26 PERFORMANCE (Jul–Sep 2025)
Revenue
• Consolidated Revenue: ₹156.87 crore (+239% YoY vs ₹46.24 crore in Q2 FY25)
• Sequential growth: +32.5% QoQ vs Q1 FY26
Profitability
• Net Profit: ₹10.54 crore (some sources report ₹10.16 crore – minor reporting variation)
• Net Profit Margin: 6.48% (compressed from prior quarters)
• Operating Margin: 11.04%
Key Points
• Strong revenue momentum continued
• Margins at trough levels during scale-up phase
• Operating profit grew 26% QoQ to ₹17.32 crore
Q1 FY26 PERFORMANCE (Apr–Jun 2025)
Revenue
• Consolidated Revenue: ₹118.43 crore (+99% YoY vs ₹59.50 crore in Q1 FY25)
• Strong start to fiscal year
Profitability
• Net Profit: ₹9.69 crore (+79% YoY vs ₹5.41 crore)
• Net Profit Margin: ~8.18%
• Standalone EBITDA Margin: 15.68%
Strategic Highlights
• Power Transmission Solutions: 62.8% of revenue
• New & Renewable Energy: 37.2% of revenue
• Order book at ₹757 crore (+82% YoY)
• Utilized funds from ₹91.16 crore preferential issue for working capital and expansion
9M FY26 CUMULATIVE PERFORMANCE (Apr–Dec 2025)
Consolidated Results
• Revenue from Operations: ₹486.33 crore (+138% YoY vs ₹204.15 crore in 9M FY25)
• Total Income: ₹493.76 crore
• EBITDA: ₹64.52 crore (+82% YoY)
• Profit After Tax: ₹36.50 crore (+90% YoY vs ₹19.23 crore)
• EBITDA Margin: 13.27% (compressed from 9M FY25 levels)
Standalone Results (9M FY26)
• Revenue: ₹293.63 crore (+46.75% YoY vs ₹200.10 crore)
• Total Income: ₹300.58 crore
Q4 FY25 PERFORMANCE (Jan–Mar 2025) – FOR CONTEXT
Revenue
• Consolidated Revenue: ₹194.66 crore (nearly double vs Q3 FY25’s ₹98.44 crore)
• Exceptional quarter-end execution
Profitability
• Net Profit: ₹12.88 crore (+31.6% vs Q3 FY25)
• Net Profit Margin: 6.62% (compressed due to large project execution)
6. ANNUAL PERFORMANCE
FY25 CONSOLIDATED RESULTS (FULL YEAR)
Revenue & Growth
• Revenue from Operations: ₹399.11 crore (vs ₹208.84 crore in FY24, +91.1% YoY)
• Total Income: ₹406.46 crore
• Industry-leading growth rate demonstrating strong execution capability
Profitability
• Net Profit: ₹32.05 crore (vs ₹21.89 crore in FY24, +46.4% YoY)
• EPS: ₹29.06 (vs ₹21.45 in FY24, +35.5% YoY)
• Net Profit Margin: 8.03% (vs 10.48% in FY24) – margin compression evident
Balance Sheet Strength
• Total Assets: ₹492.15 crore
• Net Worth: ₹208.02 crore
• Shareholder Equity: ₹254 crore
• Debt-to-Equity: 0.29x (significantly improved from 0.75x in FY24)
Cash Flow
• Operating Cash Flow: Positive but working capital intensive
• Cash & Equivalents: ₹140 million (net cash positive company)
FY25 STANDALONE RESULTS
• Revenue: ₹295.48 crore (vs ₹207.43 crore in FY24, +42.4% YoY)
• PAT: ₹31.49 crore (vs ₹21.33 crore in FY24, +47.6% YoY)
• Standalone EPS: ₹29.57 (vs ₹20.92 in FY24)
INDUSTRY COMPARISON & AUDIT NOTE
Audit Opinion
The FY25 consolidated results received a qualified audit opinion due to delayed correction of a material error in a joint venture's financial statements. Management attributed this to internal approval process delays within the JV partner. This is a governance red flag that investors should monitor.
Industry Comparison
• Industry average EBITDA margin: 14–18%
• Advait's EBITDA margin (9M FY26): 13.27%
• Gap indicates either aggressive pricing for market share or cost structure challenges
HISTORICAL PERFORMANCE TRAJECTORY
Metric | FY22 | FY23 | FY24 | FY25 | 9M FY26*
Revenue (₹ Cr) | 78.5 | 115.3 | 208.8 | 399.1 | 486.3
PAT (₹ Cr) | 6.5 | 9.8 | 21.9 | 32.1 | 36.5
PAT Margin (%) | 8.3% | 8.5% | 10.5% | 8.0% | 7.5%
ROE (%) | 14.1% | 18.5% | 47.3% | 42.4% | –
*9M annualized run-rate
Key Trends
• Revenue: Explosive CAGR of ~71% (FY22–FY25)
• Margins: Volatile and compressing in recent quarters
• ROE: Exceptional at 42%+ indicating high capital efficiency
• Consistency: Seven consecutive quarters of growth
7. STRATEGIC INVESTMENTS & EXECUTION
Major Strategic Initiatives
1. Green Hydrogen Manufacturing Capacity Expansion
Timeline & Milestones
• Phase 1 (Completed): 120 MW/year electrolyser facility in Kadi, Gujarat – OPERATIONAL
• Phase 2 (In Progress): Expansion to 200 MW/year under SECI-PLI program – ON TRACK
• Investment: Significant capex allocated from preferential issue proceeds
Say-to-Do Status: Executing as Promised – facility operational and ramping production
2. TECO 2030 Partnership (Norway) – Fuel Cell Technology
Structure
• Advait Energy Holdings AS acquired 4.89% equity stake in TECO 2030 AS (Norway)
• MoU signed April 11, 2024 for fuel cell commercialization in India and SRAAC markets
• Focus: Marine-grade and stationary fuel cell systems
Strategic Value
• Access to proven PEM fuel cell technology
• Import substitution opportunity in fuel cells
• Potential for technology transfer and localization
Say-to-Do Status: Executing Well – staged investments completed, technology transfer progressing
3. Haryana City Gas MoU (January 2025)
Project Details
• 2,000 MTPA green hydrogen production facility
• Includes 15 MW electrolyser with EPC, Balance of Plant (BoP), O&M and advisory services
• Location: Haryana
Say-to-Do Status: Early Stage – non-binding MoU; awaiting definitive commercial agreements and project FID
4. India Energy Week 2026 MoUs (January 27–30, 2026)
Through subsidiary Advait Greenergy Private Limited, signed multiple strategic MoUs:
Partner | Technology / Focus | Strategic Rationale
V J Industries | Hydrogen storage systems | Integration capability for end-to-end H2 solutions
CENmat | PEM & AEM electrolyser technology | Next-generation electrolyser tech with better efficiency
Power to Hydrogen Inc | AEM electrolyser-based projects | Project execution pipeline
Say-to-Do Status: Non-Binding MoUs – definitive agreements and execution timelines pending. High risk of non-conversion given multiple parallel MoUs.
5. Advaiteco Technologies Launch (Mid-2025)
Structure
• Wholly-owned subsidiary for manufacturing green hydrogen ecosystem components
• Manufacturing: Electrolysers, fuel-cell stacks, hydrogen refueling stations, storage units
• Strategic goal: Import substitution and Atmanirbhar Bharat alignment
Say-to-Do Status: Established and Operational – subsidiary incorporated and manufacturing initiated
The "David vs. Goliath" Hydrogen Segment Comparison
Feature | Advait (The David) | Reliance / L&T (The Goliaths) | Strategic Implication
Manufacturing Scale | 200 MW/year (Target FY27) | 1.5 GW to 5 GW+ | Advait is ~25x smaller than Reliance
Target Market | Distributed Hydrogen (10–50 MW systems) | Gigawatt-scale industrial projects | Avoids direct mega-tender competition
Competitive Edge | Nimbleness & customization | Economy of scale & deep pockets | Faster pivot to niche customers
Technology Strategy | Partnership-based (TECO 2030, CENmat) | Heavy in-house R&D + acquisitions | Capital-efficient but partner-dependent
Cost Advantage | PLI benefits (~15–20% cost edge) | Integrated value chain | Wins on entry price; loses on lifecycle cost
6. Carbon Credit Business Development
Targets
• Current Holdings: 4+ million carbon credits
• Target by 2027: 80 million+ carbon credits (20x growth in 1.5 years)
• Business Model: Carbon credit aggregation, consultancy, and trading
Say-to-Do Status: HIGHLY AGGRESSIVE TARGET – 20x growth in 18 months appears unrealistic without major M&A or partnerships. High probability of missing target.
7. MAJOR ORDER WINS (RECENT)
₹216 Crore EPC Order (Q3 FY26)
• Customer: Paschim Gujarat Vij Company Limited (PGVCL)
• Scope: Reconductoring of 11 kV distribution lines
• Largest single order in company history
• Execution timeline: 18–24 months
Execution Assessment – Say-to-Do Ratio
Initiative | Committed | Delivered | Status | Score
Electrolyser Manufacturing (120 MW) | ✓ | ✓ | Operational | 10/10
TECO 2030 Partnership | ✓ | ✓ | Stake acquired, progressing | 9/10
Advaiteco Subsidiary | ✓ | ✓ | Incorporated & operational | 10/10
Order Book Growth | ₹757 Cr | ₹1,048 Cr | 132% YoY achieved | 10/10
Multiple MoUs (2026) | Multiple | Pending | Non-binding, awaiting conversion | 3/10
Carbon Credit Target (80M by 2027) | ✓ | 4M current | 5% of target achieved | 2/10
Haryana H2 Project | MoU signed | Pending | Awaiting definitive agreement | 4/10
Overall Say-to-Do Ratio: 68/100 (Moderate)
Strengths
• Core manufacturing and partnership execution is strong
• Order book growth exceeding guidance
• Technology partnerships successfully established
Concerns
• Multiple non-binding MoUs create announcement fatigue without binding commitments
• Carbon credit target appears aspirational rather than achievable
• Green hydrogen project conversion rate from MoU to firm orders needs monitoring
Investment Implication:
Management is executing well on core business and manufacturing setup, but overpromising on early-stage initiatives (carbon credits, multiple MoUs). Focus on order book and revenue delivery rather than MoU announcements.
8. RAW MATERIALS & SUPPLY CHAIN ADVANTAGES
Key Raw Materials by Business Segment
For Power Transmission Business
• Aluminum (for ACS wires and conductors) – sourced domestically and internationally
• Steel (for structural components and ACS wire cores)
• Optical fibers (for OPGW manufacturing)
• Copper (for electrical connections and conductors)
• Specialized alloys and high-tensile strength materials
For Green Hydrogen Business
• PEM membranes and catalysts (Platinum Group Metals – critical and expensive)
• Nickel compounds (for alkaline electrolyser electrodes)
• Alkaline materials (potassium hydroxide – KOH)
• Bipolar plates (graphite/stainless steel)
• Stack components and sealing materials
• Power electronics and control systems
For BESS Business
• Lithium-ion cells (imported primarily from China/South Korea)
• Battery Management Systems (BMS) components
• Thermal management materials
• Inverters and power conversion systems
Supply Chain Strengths
1. Technology Partnership Benefits
• JV with TG China for OPGW/OFS manufacturing provides:
– Technology transfer for optical fiber production
– Potential preferential pricing on components
– Quality assurance and technical support
Risk: China dependency creates geopolitical vulnerability
2. Electrolyser Component Partnerships
• TECO 2030 (Norway) for fuel cell stacks and components
• CENmat for PEM/AEM electrolyser technology and materials
• Power to Hydrogen Inc. for electrolyser systems
Benefit: Diversified sourcing reduces single-supplier dependency
3. Domestic Manufacturing Base
• Manufacturing facility in Gujarat provides:
– Lower logistics costs for Indian projects
– “Make in India” compliance for PLI benefits
– Better working capital management vs. imports
– Ability to customize for local requirements
4. Long-term Customer Relationships
• Power utilities (PGVCL, state distribution companies) provide:
– Predictable demand patterns
– Payment security (government-backed entities)
– Repeat order opportunities
Supply Chain Advantages Assessment
• No evidence of exclusive raw material supply contracts
• No backward integration into critical raw materials (aluminum, copper smelting)
• No cost leadership through raw material sourcing
• Technology partnerships provide access advantage but not cost advantage
• Domestic manufacturing provides speed-to-market advantage
Overall Assessment:
Advait has moderate supply chain positioning through technology partnerships but lacks deep structural advantages in raw material procurement. The company is a price-taker in commodity markets (aluminum, steel, copper) and dependent on global supply chains for critical green hydrogen components.
9. SUPPLY CHAIN DEPENDENCIES & GEOPOLITICAL RISKS
Critical Dependencies – Risk Matrix
Dependency Category | Source Region | Risk Level | Impact if Disrupted | Mitigation Strategy
Optical Fiber Components | China (via TG China JV) | High | OPGW business halts | Limited alternatives; consider diversification
Platinum Group Metals | South Africa (75%), Russia (10%) | Medium | PEM electrolyser production impacted | Shift to alkaline or AEM technology
Lithium-ion Battery Cells | China, South Korea | High | BESS projects delayed | Domestic cell manufacturing emerging (2027+)
Aluminum/Steel | Domestic + Imports | Low | Price volatility only | Multiple suppliers, commodity market
Fuel Cell Components | Norway (TECO 2030) | Low | Stable European supply | Long-term partnership, technology transfer
Power Electronics | China, Taiwan | Medium | Inverter/BMS costs increase | Growing domestic alternatives
Geopolitical Risk Analysis
1. India–China Relations (HIGH RISK)
Exposure:
• JV with TG China for OPGW manufacturing
• Potential sourcing of optical fiber, power electronics, battery cells from China
• Industry-wide dependency on Chinese battery cells for BESS
Risk Scenarios:
• Border tensions leading to import restrictions
• JV structure could face regulatory scrutiny under FDI rules
• Supply chain disruptions if trade restrictions imposed
Mitigation Status:
• Limited mitigation currently in place
• Government pushing domestic manufacturing under PLI (long-term positive)
• OPGW JV is operational risk if regulations tighten
Probability: Medium (20–30% over 3 years)
Impact if Realized: High (revenue impact 15–25% if OPGW business affected)
2. Russia–Ukraine Conflict & Energy Markets (MEDIUM RISK)
Exposure:
• Indirect through metal prices (palladium, nickel from Russia)
• Global energy costs affecting input material prices
• PGM supply constraints if sanctions expand
Impact:
• Price volatility in raw materials
• Margin pressure if unable to pass through costs
• Longer lead times for PEM electrolyser components
Mitigation:
• Alkaline electrolyser technology does not require PGM
• AEM technology reduces PGM dependence
• Diversified electrolyser portfolio
Probability: Medium-High
Impact: Medium (margin compression 100–200 bps if sustained)
3. Taiwan Semiconductor / Electronics Risk (LOW–MEDIUM RISK)
Exposure:
• Power electronics, inverters, BMS chips from Taiwan/China supply chain
• Control systems for electrolysers
Mitigation:
• Growing domestic power electronics manufacturing
• Multiple sourcing options available
• Less critical than battery cells
Probability: Low (10–15% over 5 years)
Impact: Medium
4. Middle East Instability (LOW RISK)
Exposure:
• Aluminum/steel prices affected by energy costs
Impact: Limited – primarily margin pressure from input cost inflation
5. US–China Tech Decoupling (MEDIUM RISK)
Exposure:
• Advanced battery technology and manufacturing equipment
• Semiconductor components for control systems
• Potential export controls on green technology
Opportunity:
• India positioning as “trusted” manufacturing alternative
• PLI scheme benefits
• Potential for increased orders as companies diversify from China
Net Assessment: Moderate opportunity if Advait executes well on domestic manufacturing
Overall Geopolitical Risk Score: 6.5/10 (Medium-High)
Key Vulnerabilities:
- China JV and supply chain dependency
- PGM supply concentration
- Battery cell import dependency
Recommendations for Risk Mitigation:
• Accelerate technology transfer from JV
• Focus on alkaline and AEM electrolysers
• Build inventory buffers for critical imported components
• Develop alternative supplier relationships outside China
• Monitor regulatory environment for Chinese JV structures
For Investors: Geopolitical supply chain risks are manageable but real. Diversification into multiple
technology platforms (alkaline, PEM, AEM) provides hedge. China dependency in OPGW business is a
structural concern with no easy solution short-term.
10. Raw Material Shortage Risks
Potential Shortage Scenarios & Impact Assessment
1. Platinum Group Metals (PGM) Shortage
Affected Products: PEM electrolysers (require platinum/iridium catalysts)
Probability: Medium (30-40%)
• Concentrated supply: South Africa (75% global production), Russia (10%)
• Mining disruptions, labor strikes, geopolitical sanctions
• Increasing demand from automotive (fuel cells), industrial (catalysts)
Impact if Shortage Occurs: High
• PEM electrolyser production halted or significantly constrained
• Catalyst costs spike 50-100%+
• Customer delivery delays and potential order cancellations
Company's Mitigation Strategy:
• Technology diversification: Manufacturing both alkaline (no PGM) and PEM electrolysers
• AEM technology: Partnership with CENmat for Anion Exchange Membrane electrolysers
(minimal PGM requirement)
• Catalyst recycling: Exploring catalyst recovery programs (not yet operational)
• Limited inventory buffering: No disclosed long-term PGM supply contracts
Mitigation Effectiveness: Moderate (6/10) - Technology alternatives available but not fully scaled
2. Aluminum/Steel Price Volatility & Supply
Affected Products: ACS wires, transmission equipment, structural components
Probability: High (60-70%)
• Cyclical commodity markets with high volatility
• Energy costs (electricity-intensive smelting) drive prices
• China overcapacity vs. India import dependency
Impact if Prices Spike: Medium
• Direct material cost increases 20-40%
• Gross margin compression 200-400 bps
• Competitive pressure if unable to pass through to customers
Company's Mitigation Strategy:
• Limited hedging: No evidence of commodity price hedging programs (likely due to working
capital constraints)
• Pass-through clauses: Many EPC contracts include price variation clauses
• Execution timing risk: Fixed-price contracts exposed to commodity inflation
Mitigation Effectiveness: Low-Moderate (4/10) - Primarily dependent on pass-through; limited active
hedging
Current Evidence: Q3 FY26 margin compression (15.5% → 11.45%) may partially reflect commodity
cost pressures not fully passed through.
3. Optical Fiber Supply Disruption
Affected Products: OPGW (Optical Ground Wire) manufacturing
Probability: Medium (25-35%)
• Concentrated manufacturing in China/Japan
• JV dependency on TG China
• Trade restrictions or geopolitical tensions
Impact if Disrupted: High for OPGW Segment
• OPGW production halted (estimated 15-20% of revenue)
• Telecom infrastructure projects delayed
• Customer penalties for non-delivery
Company's Mitigation Strategy:
• JV provides some buffer but doesn't eliminate China dependency
• No alternative fiber sourcing publicly disclosed
• Limited backward integration
Mitigation Effectiveness: Low (3/10) - Structural dependency on JV partner
4. Lithium-ion Battery Cell Shortage (for BESS)
Affected Products: Battery Energy Storage Systems
Probability: Medium (40-50%)
• Global EV demand competing for same cells
• China dominates supply (70%+ global capacity)
• Geopolitical tensions could restrict exports
Impact if Shortage/Price Spike: High
• BESS projects economically unviable or delayed
• Competitor advantage for those with long-term supply agreements
• New & Renewable Energy segment growth stalled
Company's Mitigation Strategy:
• No disclosed long-term battery supply agreements
• No equity stakes in battery manufacturers
• India domestic cell manufacturing emerging (2027+) but not yet scaled
• BOO model flexibility: Can delay deployment if economics unfavorable
Mitigation Effectiveness: Low (3/10) - Exposed to global battery market dynamics
5. Semiconductor/Power Electronics Shortage
Affected Products: Inverters, BMS, electrolyser control systems
Probability: Medium (30-40%)
• Auto industry and renewable sector competing for same chips
• Taiwan/China concentration risk
• Fab capacity constraints
Impact if Shortage: Medium
• Project execution delays (3-6 months)
• Cost increases passed to customers (limited margin impact)
• Order book conversion timing affected
Company's Mitigation Strategy:
• Multiple component suppliers for inverters/BMS
• Growing domestic alternatives (Tata Electronics, Dixon entering)
• No long-term semiconductor supply arrangements
Mitigation Effectiveness: Moderate (5/10) - Industry-wide issue, Advait not uniquely vulnerable
Consolidated Raw Material Risk Assessment
Material/Component | Shortage Probability | Impact Severity | Mitigation Quality | Overall Risk Score
Platinum Group Metals | Medium (30%) | High | Moderate (6/10) | 5.5/10
Aluminum/Steel | High (60%) | Medium | Low-Mod (4/10) | 6.0/10
Optical Fiber | Medium (25%) | High (segment) | Low (3/10) | 5.5/10
Li-ion Battery Cells | Medium (40%) | High | Low (3/10) | 6.5/10
Semiconductors | Medium (30%) | Medium | Moderate (5/10) | 4.5/10
Overall Raw Material Shortage Risk: 5.6/10 (Medium)
Key Takeaways:
• Battery cell supply is highest risk with limited mitigation
• Commodity price volatility (Al/steel) already impacting margins
• Technology diversification in electrolysers provides good PGM hedge
• Optical fiber dependency through China JV is structural vulnerability
For Investors: Raw material risks are material and increasing. Management should:
- Secure long-term battery supply agreements for BESS growth
- Implement commodity hedging programs for aluminum/steel
- Accelerate technology transfer from China JV to reduce dependency.
- Build strategic inventory of long-lead-time components.
Current Mitigation Status: 4.2/10 (Insufficient) - Requires significant improvement to support
aggressive growth plans.
11. Industry-Specific Sales Risks
Macro & Sectoral Risk Factors
1. Government Capex Dependency (CRITICAL RISK)
Exposure Level: Very High (70-80% of revenue)
• Primary customers: Central/State electricity utilities (PGVCL, discoms)
• EPC projects funded through government budgets and multilateral loans
• Power transmission projects require regulatory approvals (CEA, state commissions)
Risk Scenarios:
• Fiscal tightening: Central/state budget constraints reducing capex allocations
• Election cycle delays: Project approvals delayed during elections (FY27 risk with general elections
possible)
• Payment delays: Government entities delaying payments during fiscal stress
• Project cancellations: Scope reductions or project shelving
Current Environment: FAVORABLE
• Union Budget 2026 emphasizes energy security and grid strengthening
• Renewable integration requires massive transmission infrastructure buildout
• PM Kusum scheme and solar mission driving EPC demand
• International climate finance (World Bank, ADB) supporting projects
Sensitivity Analysis:
• 10% reduction in government capex → 5-7% revenue impact, 100-150 bps margin impact
• 20% reduction → 12-15% revenue impact, potential EBITDA breakeven
• Payment delays (90-120 days additional) → working capital stress, potential equity dilution
Company's Exposure Management:
• Strong order book (₹1,048 Cr) provides 12-15 months visibility
• Diversification into private solar EPC (corporate PPAs)
• High receivables (173 days) indicates payment collection challenges
Overall Risk Rating: Medium (current environment favorable, but structural dependency remains)
2. Green Hydrogen Policy Uncertainty (STRATEGIC RISK)
Exposure Level: High (15-20% of revenue, 40-50% of growth strategy)
Policy Dependencies:
• PLI Scheme for Electrolysers: ₹4,400 crore allocated, incentivizes domestic manufacturing
• National Green Hydrogen Mission: 5 MMT production target by 2030
• Green Hydrogen Purchase Obligations: Mandates for fertilizer, refining sectors (implementation
pending)
• Subsidies & Incentives: Viability gap funding, tax credits for green hydrogen
Risk Scenarios:
• Subsidy delays: Budget constraints delaying incentive disbursements
• Target reductions: 5 MMT target scaled back to 2-3 MMT (demand destruction)
• Import competition: Cheaper imported electrolysers undermining domestic players
• Technology shifts: Green hydrogen economics unviable vs. grey hydrogen
• Blending mandate delays: Mandatory H2 blending in natural gas delayed or reduced
Current Status: MIXED SIGNALS
• Policy framework in place with strong government commitment
• Implementation pace slower than expected (fiscal constraints)
• Electrolyser capacity buildout ahead of demand (potential oversupply by 2027)
• PLI beneficiaries (including Advait) have cost advantage vs. imports
Impact Analysis:
• Base case (50% probability): Green H2 scales as planned → Advait's electrolyser revenue reaches
₹200-300 Cr by FY28
• Bear case (30% probability): Delays and scaling back → Electrolyser revenue caps at ₹50-75 Cr,
stranded assets
• Bull case (20% probability): Accelerated adoption → Revenue potential ₹500+ Cr by FY29
Company's Response:
• Diversified across multiple electrolyser technologies (alkaline, PEM, AEM)
• Maintained core transmission business as cash cow
• Heavy capex commitment to electrolyser capacity (sunk cost risk)
Overall Risk Rating: High (policy execution risk threatens 40-50% of growth strategy)
3. Solar & BESS Project Execution Risks
Exposure Level: Medium (10-15% of revenue, growing)
Execution Challenges:
• Land acquisition: Delays in securing land for solar farms and storage sites
• Grid connectivity: Evacuation infrastructure lagging renewable capacity additions
• Module supply: Solar panel pricing volatility and import dependency
• Battery costs: Li-ion cell prices volatile (geopolitical, demand-supply)
• Offtaker risk: Discom financial health and PPA honoring
Recent Industry Data:
• 30-40% of solar projects face delays beyond 6 months
• Grid connectivity approval timelines: 12-24 months (state-dependent)
• Discom payment delays averaging 4-6 months in several states
Company's Exposure:
• EPC model (not developer) transfers most execution risk to customers
• BOO model for BESS allows flexibility in deployment timing
• Working capital intensive if payment delays cascade
Overall Risk Rating: Medium (industry-wide challenges, Advait not uniquely vulnerable)
4. Commodity Price Cycles (MARGIN COMPRESSION RISK)
Exposure Level: Very High
Key Commodities:
• Aluminum: 30-35% of transmission equipment COGS
• Steel: 15-20% of COGS
• Copper: 10-15% of COGS
• Crude oil: Indirect (plastics, insulation materials, transportation)
Current Cycle Status: INFLATIONARY PRESSURE
• Aluminum: $2,200-2,500/MT (elevated vs. $1,800 historical average)
• Steel: ₹50,000-55,000/MT in India (moderate inflation)
• Copper: $8,500-9,000/MT (high but stable)
Historical Volatility:
• Aluminum: ±30-40% swings over 12-18 months
• Copper: ±40-50% swings
Evidence of Impact:
• Q3 FY26 margin compression: Operating margin from 15.5% → 11.45% YoY likely includes
commodity cost impact
• Sequential QoQ improvement suggests partial pass-through success or price stabilization
Company's Response:
• Limited hedging capabilities (working capital constraints for futures positions)
• Price escalation clauses in EPC contracts (partial protection)
• Execution timing risk: Fixed-price contracts in rising commodity environment
Sensitivity:
• 10% commodity price increase → 150-200 bps margin compression if not passed through
• 20% increase → 300-400 bps compression (observed in Q3 FY26 YoY)
Overall Risk Rating: High (direct evidence of margin impact in recent quarters)
Company’s Sectoral Risk Response Plans
Management’s Articulated Strategies
- Diversification Across Segments
o Transmission (mature, stable) + Green Energy (high growth) + Telecom (steady)
o Reduces single-sector dependency - BOO Model for BESS
o Build-Own-Operate model creates recurring revenue
o Reduces project execution risk
o Annuity-like cash flows - International Expansion
o 45+ countries presence diversifies away from India policy risk
o Currently ~25-30% of revenue from international - Technology Leadership
o Early PLI benefits create cost advantage
o Multiple electrolyser technologies hedge technology obsolescence - Order Book Focus
o Strong order book (₹1,048 Cr, 132% YoY growth) provides visibility
o Focus on firm orders vs. MoUs
Effectiveness Assessment: Moderate (6/10)
• Strategies are sound but execution capacity constraints
• Diversification is genuine but government dependency remains structural
• International presence provides only partial hedge
Overall Industry Sales Risk: 7.5/10 (High)
Risk Distribution
Risk Factor | Weight | Score (1-10) | Weighted Score
Government Capex Dependency | 30% | 7.0 | 2.1
Green H2 Policy Uncertainty | 25% | 8.5 | 2.1
Commodity Price Cycles | 20% | 8.0 | 1.6
Discom Payment Risk | 15% | 8.0 | 1.2
Project Execution Challenges | 10% | 6.0 | 0.6
TOTAL | 100% | - | 7.6/10
Key Takeaways for Investors
Top 3 Risk Areas:
- Policy execution on green hydrogen (threatens growth narrative)
- Commodity price inflation (already compressing margins)
- Government payment delays (working capital strain)
Mitigating Factors:
- Strong order book provides near-term visibility
- Favorable policy environment currently
- Diversified business model with mature cash-generating segments
Monitor Quarterly:
- Receivables days trend (target: below 150 days)
- Order book composition (transmission vs. green energy mix)
- Operating margin trajectory (target: stabilization above 12-13%)
- MoU to firm order conversion rate
Investment Implication:
High dependence on government policy execution and discom financial health creates elevated business risk suitable only for investors with high risk tolerance and 3–5 year horizon. Current valuation (47–60x PE) does not adequately compensate for these risks.
12. Research, Technology & Intellectual Property
R&D Investment & Focus Areas
R&D Spending:
Specific R&D expenditure figures are not publicly disclosed in available financial statements. However, based on industry benchmarks and company’s technology initiatives, estimated R&D intensity is 2–3% of revenue (₹8–12 crore annually).
Technology Development Focus
1. High-Temperature Low-Sag (HTLS) Conductors
• Developing advanced HTLS wires for high-voltage transmission
• Operating temperature range: 150–250°C (vs. conventional 75–100°C)
• Benefits: 50–100% higher current carrying capacity on same towers
• Status: R&D phase, partnerships with material suppliers
• Commercial Timeline: FY27–FY28
2. Green Hydrogen Production Technologies
a) Alkaline Electrolysers
• Current production capacity: 120 MW/year, expanding to 200 MW
• Efficiency targets: 60–70% (system efficiency)
• Status: Operational and commercialized
b) PEM (Proton Exchange Membrane) Electrolysers
• Higher efficiency (70–80%) but expensive catalysts (platinum/iridium)
• Compact design suitable for distributed applications
• Status: Technology access through partnerships, manufacturing in setup phase
c) AEM (Anion Exchange Membrane) Electrolysers
• Next-generation technology combining alkaline economics with PEM efficiency
• No platinum group metals required
• Partnership with CENmat for technology development
• Status: Pilot phase, commercial launch expected FY27
3. Fuel Cell Systems
• Partnership with TECO 2030 (Norway) for PEM fuel cells
• Target applications: Stationary power, marine propulsion, backup power
• Power range: 100 kW to 2 MW modules
• Status: Technology transfer ongoing, assembly facility being established
4. Battery Energy Storage Systems (BESS)
• Integration of lithium-ion battery packs with advanced BMS
• Microgrid solutions combining solar + BESS + hydrogen
• Software development for grid integration and optimization
• Status: Commercial pilots underway
5. Hydrogen Storage & Compression
• Type III and Type IV composite pressure vessels (350–700 bar)
• Metal hydride storage systems (solid-state storage)
• Partnership with V J Industries for storage technologies
• Status: Early development phase
Intellectual Property Portfolio
Patent Disclosure:
Company has not publicly disclosed a significant patent portfolio in investor presentations or annual reports.
IP Strategy Assessment:
• Weak proprietary IP: No evidence of breakthrough patents in core technologies
• Partnership-based IP access: Leveraging partners’ patents through licensing/JV
• Trade secrets: Likely relying on manufacturing process know-how vs. patents
• First-mover advantage: Speed to market rather than IP protection
Competitive Position:
• Technology followers rather than technology leaders
• Access-based strategy: Acquiring technology through partnerships vs. internal R&D
• Manufacturing excellence: Focus on production efficiency vs. invention
Key Technology Partnerships (IP Access Mechanism)
Partner | Technology Domain | IP Access Mechanism | Strategic Value | Duration
TECO 2030 (Norway) | PEM Fuel Cells | 4.89% equity stake + licensing agreement | Marine-grade fuel cell technology, IP sharing | Long-term (5+ years)
TG China | OPGW / Optical Fiber | Joint Venture | Optical fiber manufacturing technology | Ongoing JV
CENmat | PEM & AEM Electrolysers | MoU for technology collaboration | Next-gen electrolyser IP access | To be defined
Power to Hydrogen Inc. | AEM Electrolysers | Project collaboration MoU | AEM technology for projects | Non-binding MoU
V J Industries | Hydrogen Storage | Technology partnership MoU | Storage system integration | Non-binding MoU
Technology Advantages & Limitations
Strengths:
- Multi-technology platform: Alkaline, PEM, AEM provides customer optionality
- Access to proven technology: TECO 2030 fuel cells are mature, marine-tested
- Manufacturing scale: 120 MW electrolyser capacity among largest in India
- Integration capability: End-to-end solutions from production to storage
- PLI benefits: Cost advantage vs. imports (15–20% subsidy equivalent)
Weaknesses:
- No proprietary breakthrough technology: Dependent on partners for core IP
- Technology lag vs. global leaders: 2–3 years behind Siemens, Nel, Plug Power
- Licensing costs: Paying royalties/fees reduces margins vs. proprietary tech
- Partner dependency: TECO 2030 financial distress could impact fuel cell business
- Limited R&D budget: Cannot compete with Reliance/L&T on innovation spending
Innovation Pipeline & Commercialization Timeline
Near-Term (FY26-FY27): Production Scale-Up
• Scale electrolyser production to 200 MW/year capacity
• Commence fuel cell assembly operations
• Deploy first BESS BOO projects (50-100 MWh)
• Solar EPC expansion to ₹200+ crore run-rate
Mid-Term (FY28-FY29): Technology Diversification
• Launch commercial AEM electrolysers (higher efficiency, lower cost)
• Green ammonia synthesis pilots (value chain integration)
• Hydrogen refueling station network (10-15 stations)
• HTLS conductor commercialization
Long-Term (FY30+): Value Chain Integration
• Green methanol/SAF (Sustainable Aviation Fuel) production
• Backward integration into stack component manufacturing
• International technology licensing (reverse flow)
Technology Leadership Assessment
Overall Technology Score: 5.5/10 (Moderate, Dependent on Partnerships)
Dimension | Score (1-10) | Rationale
Proprietary IP | 3 | Minimal patents, no breakthrough technologies
Technology Access | 8 | Strong partnerships provide access to proven tech
Manufacturing Capability | 7 | Among leading domestic electrolyser producers
R&D Intensity | 4 | Limited budget vs. competitors
Innovation Pipeline | 6 | Solid roadmap but incremental vs. disruptive
Technology Execution | 7 | Demonstrated ability to commission and operate
Comparative Positioning
• vs. Global Leaders (Siemens, Nel, Plug Power): Technology lag of 2-3 years, 30-40% cost advantage in Indian market
• vs. Indian Peers (Reliance, L&T, Greenko): Smaller scale but earlier mover, niche focus
• vs. Small-cap Competitors: Ahead in manufacturing scale and technology partnerships
Key Insight: Advait is a "fast follower" with manufacturing focus rather than a technology pioneer. The partnership-based IP access model is capital efficient but creates dependency risk and limits premium pricing power.
For Investors
• Sufficient technology capability to execute current growth plans
• Unlikely to achieve technology leadership premiums
• Vulnerable if partners restrict technology access or if breakthrough technologies emerge
• Manufacturing cost advantage in India creates near-term moat
Patent Expiration Risk: Not applicable given minimal proprietary patent portfolio. However, technology obsolescence risk is real if breakthrough AEM or solid-state electrolysers commercialize at scale by competitors.
13. Segment Analysis
Business Segment Breakdown
Based on Q3 FY26 and 9M FY26 disclosures, Advait operates primarily through two reportable segments:
1. Power Transmission Solutions (PTS)
Segment Contribution
• Revenue: ~84% of total revenue (~₹408 crore in 9M FY26)
• Order Book: 84% of ₹1,048 crore = ₹880 crore
Products & Services
• Stringing tools and equipment
• ACS (Aluminum Clad Steel) wire manufacturing
• OPGW (Optical Ground Wire) manufacturing (JV with TG China)
• Emergency Restoration Systems (ERS)
• Live-line installation services
• EPC services for transmission lines and substations
• Telecom tower infrastructure (included in this segment)
Growth Trajectory
• 9M FY26: Strong growth driven by ₹216 crore PGVCL order execution
• Historical: Steady 15-25% CAGR over FY22-FY25
• Outlook: 10-15% CAGR expected (mature segment with government capex dependency)
Margin Profile
• Estimated EBITDA Margin: 14-16% (company doesn't disclose segment margins)
• Mature business with established customer relationships
• Margin pressure from commodity inflation
Risk Assessment: Medium
• Mature and stable cash generator
• Government capex dependent (70-80% exposure)
• Commodity price volatility
• Discom payment delays
2. New & Renewable Energy Business (NRE)
Segment Contribution
• Revenue: ~16% of total revenue (~₹78 crore in 9M FY26)
• Order Book: 16% of ₹1,048 crore = ₹168 crore
• Q3 FY26 Revenue: ₹71.56 lakh (₹7.2 crore)
Products & Services
• Electrolysers (alkaline, PEM, AEM)
• Fuel cell systems (assembly under TECO partnership)
• Battery Energy Storage Systems (BESS) - BOO model
• Solar EPC projects
• Hydrogen refueling stations (HRS)
• Carbon credit consultancy and sustainability services
Growth Trajectory
• Explosive growth: From near-zero in FY24 to ₹78+ crore in 9M FY26
• Growth Rate: 200-300%+ (from low base)
• Outlook: 50-100% CAGR expected through FY28 (policy dependent)
Margin Profile
• Estimated EBITDA Margin: 8-12% currently (low due to initial scale-up costs)
• Target margins: 15-18% at scale (FY28+)
• BOO model provides recurring revenue at higher margins (20%+ EBITDA)
Risk Assessment: High
• Policy execution risk (Green Hydrogen Mission implementation)
• Technology execution risk (new manufacturing processes)
• Competition from large players (Reliance, L&T)
• Customer adoption pace uncertain
• Subsidy dependency
Geographic Segmentation (Estimated)
While company doesn't formally report geographic segments, based on disclosed information:
Geography | Revenue Contribution | Key Projects/Customers | Growth Outlook
India | ~70-75% (₹340-365 Cr in 9M FY26) | State discoms, PGVCL, CPSU | High (15-20% CAGR)
International | ~25-30% (₹120-145 Cr in 9M FY26) | 45+ countries, diverse clients | Moderate (10-15% CAGR)
Key International Markets
• Middle East (transmission projects, ERS)
• Africa (telecom towers, power infrastructure)
• Southeast Asia (EPC services)
• Europe (limited, through technology partnerships)
International Strategy
• Risk diversification from India policy changes
• Higher realization but longer working capital cycles
• Live-line installation expertise differentiator
Product/Service Mix Analysis
Product Category | Revenue % | Margin Profile | Growth Stage | Strategic Priority
Transmission Equipment & Tools | ~40% | Medium (12-15%) | Mature | Maintain & Optimize
EPC Services (Power) | ~30% | Medium-Low (10-13%) | Growth | Expand with order book
OPGW & Telecom | ~10% | Medium (12-14%) | Mature | Stable cash flow
Green Hydrogen Equipment | ~8% | Low currently (8-10%) | Emerging | High Growth Focus
Solar EPC & BESS | ~7% | Variable (8-15%) | Growth | BOO Model Development
Carbon Credits & Consulting | ~5% | High (20%+) | Emerging | Opportunistic
Segments at Risk
1. OPGW & Optical Fiber Manufacturing – HIGH RISK
Risk Factors
• China JV dependency: TG China partnership creates supply chain and technology dependency
• Geopolitical tensions: India-China relations could impact JV operations
• Telecom sector slowdown: 5G rollout deceleration, operator capex cuts
• Fiber oversupply: Global optical fiber capacity excess putting pricing pressure
Revenue at Risk: ₹40-50 crore annually (~10% of total)
Mitigation Strategies
• Dual-use application: OPGW serves both power transmission and telecom
• No alternative technology partnerships disclosed
• Limited diversification away from China JV dependency
Management Commentary: Not explicitly addressed in recent presentations/reports
Recommendation: Monitor JV relationship closely; develop alternative sourcing contingency
2. Green Hydrogen Electrolyser Manufacturing – MEDIUM-HIGH RISK
Risk Factors
• Policy execution delays: Green Hydrogen Mission implementation slower than expected
• Demand uncertainty: Offtaker commitments (fertilizer, refining) not materializing at pace
• Competition intensifying: Reliance (5 GW), L&T (1.5 GW), Greenko entering with massive scale
• Capacity oversupply: Industry electrolyser capacity buildout ahead of demand
• Technology risk: AEM electrolysers could make current PEM/alkaline less competitive
• Subsidy dependency: PLI scheme critical for economics vs. imports
Revenue at Risk: ₹80-120 crore annually by FY28 (if demand doesn't materialize)
Mitigation Strategies
• Multiple technology platforms (alkaline, PEM, AEM) hedge technology risk
• Moderate scale (200 MW vs. Reliance 5 GW) limits capital at risk
• Export potential to Middle East, Europe if India demand slow
• Limited backward integration creates margin pressure from component suppliers
Management Commentary
• Management emphasizes "first-mover advantage" and PLI cost benefits
• Confident on policy implementation:
“Recent Union Budget's focus on energy security provides strong long-term tailwinds” – Shalin Sheth, MD
• Targeting 200 MW annual production by FY27
Monitoring Indicators
• Quarterly electrolyser order intake (target: ₹50+ crore per quarter by Q1 FY27)
• Capacity utilization (target: >60% by FY27)
• Margin trajectory (target: 12%+ EBITDA margins by FY28)
3. BESS (Battery Energy Storage Systems) – MEDIUM RISK
Risk Factors
• Battery cell supply: Li-ion cell import dependency (China/South Korea)
• Technology evolution: Solid-state batteries could disrupt Li-ion economics
• Project financing: BOO model requires significant upfront capital
• Grid integration delays: Regulatory approvals for grid-connected storage
• Offtaker risk: PPA pricing and payment reliability
Revenue at Risk: ₹30-50 crore annually (currently small segment)
Mitigation Strategies
• BOO model allows flexible deployment timing (not forced to execute if economics poor)
• Integration with solar EPC creates bundled solutions attractive to customers
• Multiple battery technology options (Li-ion, flow batteries future option)
• No disclosed long-term battery cell supply agreements (supply risk)
Management Commentary
• Focus on BOO model to create recurring revenue streams
• Target: 200-300 MWh deployed by FY28
• Selective project approach prioritizing IRR over volume
Segment Strategy & Evolution
Management's Strategic Intent
Phase 1 (FY26-FY27): Foundation Building
• Maintain transmission business as stable revenue source (stable 10-15% growth)
• Scale up green hydrogen manufacturing (200 MW capacity operational)
• Pilot BESS BOO projects (50-100 MWh deployed)
• Expand solar EPC (₹150-200 crore run-rate)
Phase 2 (FY28-FY29): Diversification & Scale
• Green hydrogen business reaches ₹200-300 crore revenue (20-25% of total)
• BESS BOO portfolio generating recurring revenue (₹50-75 crore)
• International expansion (30-35% of revenue from exports)
• Carbon credit business scaled (contingent on market development)
Phase 3 (FY30+): Value Chain Integration
• Green ammonia/methanol production (downstream integration)
• Technology licensing to other markets
• Potential IPO of green energy subsidiary (fundraising for growth)
Segment Portfolio Assessment
Boston Consulting Group (BCG) Matrix Positioning
Segment | Market Growth | Relative Market Share | BCG Classification | Strategic Action
Transmission Equipment | Low-Medium | Medium | Cash Cow | Harvest & Maintain
EPC Services (Power) | Medium | Medium-Low | Cash Cow | Selective Growth
Green Hydrogen Equipment | Very High | Low-Medium | Question Mark | Invest & Monitor
BESS & Solar EPC | High | Low | Question Mark | Selective Investment
OPGW/Telecom | Low | Low | Dog | Consider Exit/Maintain
Portfolio Balance Assessment: Moderate (6/10)
Strengths
• Cash-generating mature businesses fund high-growth investments
• Genuine diversification across power value chain
• Not over-concentrated in single segment
Weaknesses
• High exposure to government/policy (across segments)
• Two “Question Mark” segments (green hydrogen, BESS) create execution risk
• OPGW segment underperforming (“Dog” quadrant)
Recommended Portfolio Rebalancing
- Accelerate exit from OPGW/Telecom if China JV dependency can't be resolved
- Focus investments on green hydrogen (highest growth potential)
- Selective BESS deployment (quality over quantity, IRR-focused)
- Maintain transmission business as strategic anchor and cash generator
Competitive Segment Position
Segment | Advait's Position | Key Competitors | Competitive Advantage | Sustainability
Transmission Tools | Top 5 in India | Specialized tools cos. | Live-line expertise | Medium-High
ACS Wire/OPGW | Top 10 in India | Sterlite, Universal Cables | JV technology | Low-Medium
EPC Services | Top 20-25 in India | L&T, Kalpataru, KEC | Niche specialization | Low
Green H2 Equipment | Top 3-5 in India | Ohmium, Reliance (emerging) | First-mover, PLI benefits | Medium (2-3 years)
BESS | Emerging player | Greenko, ReNew, NTPC | BOO model flexibility | Low-Medium
Segment Risk Mitigation – Overall Assessment
Company's Risk Management Approach:
- Portfolio diversification genuine - not over-reliant on single segment
- Cash cow funding growth - transmission business funds green energy capex
- Technology hedges - multiple electrolyser technologies reduce obsolescence risk
- Geographic diversification limited - still 70-75% India dependent
- Execution capacity stretched - simultaneously scaling multiple new businesses
Effectiveness Rating: 6.5/10 (Moderate)
Key Gaps:
• Insufficient focus on OPGW segment vulnerability
• Over-optimistic carbon credit business projections
• Limited financial cushion if multiple segments underperform simultaneously
For Investors: Advait's segment portfolio is strategically sound with mature cash-generating businesses funding high-growth green energy investments. However, execution risk is elevated given simultaneous scale-up across multiple emerging segments (green hydrogen, BESS, solar EPC). The OPGW segment is a hidden vulnerability due to China JV dependency, while green hydrogen segment success is critical to justify current valuations.
Monitor: Quarterly segment revenue mix, green hydrogen order intake, OPGW revenue trends, BESS deployment pipeline.
14. Shareholding Pattern Changes
Recent Shareholding Evolution (Dec 2024 – Dec 2025)
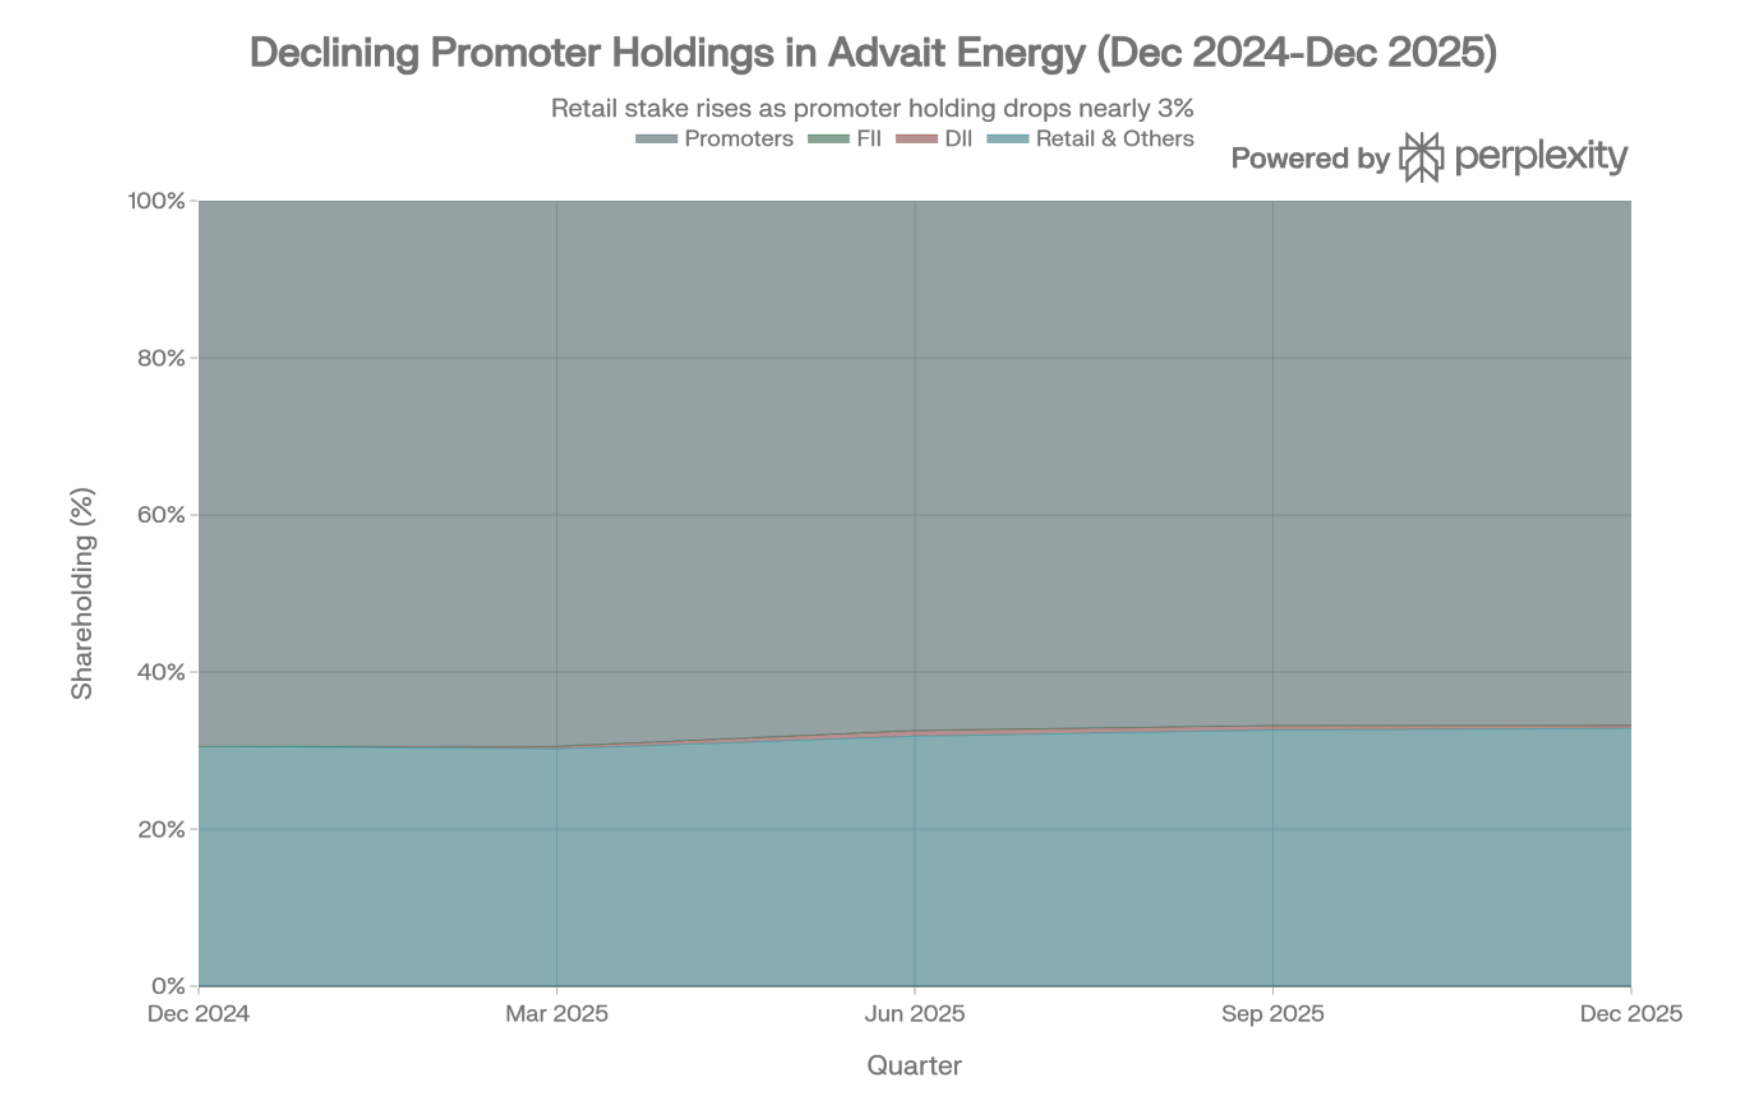
Shareholder Category | Dec 2024 | Mar 2025 | Jun 2025 | Sep 2025 | Dec 2025 | Total Change | % Change
Promoters & Promoter Group | 69.46% | 69.46% | 67.45% | 66.81% | 66.80% | -2.66% | -3.8%
Foreign Institutional Investors (FII) | 0.00% | 0.00% | 0.00% | 0.00% | 0.02% | +0.02% | -
Domestic Institutional Investors (DII) | 0.00% | 0.31% | 0.72% | 0.57% | 0.35% | +0.35% | -
Retail & Others | 30.54% | 30.23% | 31.83% | 32.62% | 32.83% | +2.29% | +7.5%
TOTAL | 100.00% | 100.00% | 100.00% | 100.00% | 100.00% | - | -
Note: January 2026 data not yet officially filed; latest available is December 2025.
Key Observations & Analysis
1. Declining Promoter Stake – Gradual but Consistent
Pattern:
• Steady quarterly reduction from 69.46% (Dec 2024) to 66.80% (Dec 2025)
• Total decline: 2.66 percentage points over 12 months
• Pace: ~0.5-0.7% per quarter on average
• Largest single-quarter drop: 2.01% (Mar 2025 to Jun 2025)
Possible Reasons:
- Funding growth initiatives: Raising capital for green hydrogen capex and working capital
- Preferential allotment: ₹91.16 crore preferential issue to institutional investors (disclosed in Q1 FY26)
- Planned diversification: Gradual stake reduction for estate planning/liquidity
- OFS/Block deals: Potential off-market transactions not publicly disclosed
Red Flags Assessment:
• No public disclosure of reasons for stake reduction
• Gradual decline (not sudden dump) suggests planned reduction
• No pledging of shares reported (positive indicator)
• Still comfortably above 50% - no immediate control concerns
• Institutional participation not increasing correspondingly - promoter exit not being absorbed by FIIs/DIIs
Management Commentary: No specific commentary on promoter stake reduction in recent investor presentations or con-calls.
2. Minimal Institutional Participation – Critical Red Flag
Foreign Institutional Investors (FII):
• Current: 0.02% (negligible, likely single small fund)
• Change: From 0.00% (virtually no FII interest)
• Interpretation: Zero validation from foreign institutional capital
Domestic Institutional Investors (DII):
• Current: 0.35% (minimal)
• Peak: 0.72% (Jun 2025) – subsequently reduced
• Volatility: DII stake fluctuating quarter-to-quarter (0.31% → 0.72% → 0.57) suggests trading behavior rather than long-term conviction
• Interpretation: Mutual funds testing positions but not building conviction
Combined Institutional Holding: 0.37% (FII + DII)
What This Means:
• Institutional investors avoiding the stock despite strong growth narrative
• No validation from sophisticated capital (mutual funds, insurance, FII)
• Suggests market skepticism about valuation, execution, or business model
• Liquidity concerns – institutional funds can't build meaningful positions in illiquid small-cap
Industry Context: Comparable small-cap renewable energy companies typically have 5-15% institutional holding. Advait's 0.37% is far below peer average.
3. Rising Retail Participation – High Volatility Risk
Pattern:
• Retail & Others increased from 30.54% (Dec 2024) to 32.83% (Dec 2025)
• Net increase: 2.29 percentage points
• Retail absorbing most of the promoter stake dilution
Interpretation:
• Retail confidence in growth story
• Momentum-driven buying rather than fundamental analysis
• High volatility risk – retail-heavy stocks prone to sharp corrections
• Weak hands – retail investors exit faster during corrections vs. institutions
Trading Behavior Evidence:
• 9.33% single-day gain post Q3 results (Feb 11) followed by -2.5% correction (Feb 13) indicates retail-driven volatility
4. No Promoter Pledging – Positive Sign
• Pledged Shares: None or <25% (sources indicate zero pledging)
• Interpretation: Promoters not using shares as collateral for loans (positive governance indicator)
• Credibility: Adds to promoter commitment despite stake dilution
Shareholding Pattern Red Flags Summary
Red Flag | Severity | Implication
Declining promoter stake without disclosed reason | Medium | Lack of transparency, potential capital needs
Zero institutional validation (0.37% FII + DII) | High | Sophisticated investors not convinced
Retail-dominated float (32.83%) | Medium | High volatility, weak investor base
DII stake reduction from peak | Medium | Early institutional investors exiting
Shareholding Comparison with Peers
Company | Promoter % | FII % | DII % | Retail % | Institutional Validation
Advait Energy | 66.80% | 0.02% | 0.35% | 32.83% | Very Weak
Dynamic Cables | ~60% | 5–8% | 8–12% | ~25% | Moderate
Industry Average (Small-cap Renewables) | 50–65% | 3–7% | 5–12% | 25–35% | Adequate
Assessment: Advait's shareholding pattern is significantly weaker than peer average, indicating market skepticism.
Implications for Investors
Positive Factors:
• Promoters still hold majority (66.80%) – control secure
• No pledging indicates financial strength
• Gradual dilution (not panic selling)
Concerns:
• Institutional avoidance is biggest red flag – suggests execution concerns, governance issues, or valuation skepticism
• Liquidity risk – difficult to build/exit large positions
• Volatility risk – retail-dominated float creates price swings
• No anchor investor – no large institutional investor providing stability
What Would Improve Confidence:
- Public disclosure of promoter stake reduction rationale
- Successful preferential allotment to QIBs (Qualified Institutional Buyers)
- Mutual fund entry with 3–5% stake
- Regular investor relations activities (concalls, analyst meets)
- Improved corporate governance disclosures
Trading Recommendation:
• For existing investors: Monitor promoter holding quarterly; exit if drops below 60%
• For new investors: Wait for institutional validation before large positions
• Position sizing: Maximum 2–3% of portfolio given institutional absence
15. Brokerage Recommendations
Coverage Status – Limited Analyst Following
As a small-cap stock (Market Cap: ₹1,909 crore), Advait Energy Transitions has minimal institutional brokerage coverage. The company is not covered by major brokerages like Motilal Oswal, ICICI Securities, Kotak Securities, HDFC Securities (research), or Axis Direct.
Available Ratings & Recommendations
1. MarketsMojo Rating (Most Comprehensive Available)
Current Rating: HOLD (upgraded from SELL in February 2026)
Mojo Score Details:
• Overall Score: Not disclosed numerically
• Valuation: Below Average (expensive at current levels)
• Quality: Good (improving financial performance)
• Technical: Upgraded from Sell to Hold (improving momentum)
• Financial Performance: Very Positive (Q3 FY26 results)
Key Commentary:
“Advait Energy Transitions Limited has seen its investment rating upgraded from Sell to Hold, reflecting a notable improvement in technical indicators and sustained financial performance. However, operating margins have contracted to 11.45%, indicating potential pricing pressures, which investors should monitor.”
Investment Recommendation: Hold for existing investors; wait for better entry point for new investors
2. Smart-Investing.in Analysis
Intrinsic Value Estimate: ₹1,720.37 (as of Feb 12, 2026)
Current Price: ₹1,745.60 (Feb 13, 2026)
Valuation Assessment: Fairly Valued (slight overvaluation ~1.5%)
Fundamental Assessment:
• Long-term Fundamentals: Good
• Valuation: Average (fairly valued)
• Debt: High (note: this appears outdated given improved 0.29x D/E)
• Quarterly Earnings Trend: Upward
• Price Momentum: Upward
• Pledged Shares: None or <25%
Recommendation: Neutral to Positive for long-term investors.
3. Univest Preview (Pre-Q3 Results)
Q3 FY26 Expectations (Pre-Result):
• PAT expected to rise 125.47%
• Net Sales expected to rise 113.15%
Actual Results:
• PAT: +77.7% (below expectations)
• Revenue: +114.4% (matched expectations)
Post-Result Implication: Results broadly in line with expectations on revenue but PAT missed aggressive estimates.
4. Retail Analyst Platforms (Caution: Not Institutional Research)
Various retail-focused platforms (SharePrice-Target.com, etc.) publish speculative long-term targets:
Timeframe | Price Target Range | Implied Return | Reliability
2026 | ₹1,142 - ₹3,195 | -36% to +83% | Very Low
2027 | ₹5,712 - ₹8,500 | +227% to +387% | Very Low
2028-2030 | ₹8,365 - ₹15,500 | +379% to +788% | Very Low
Critical Caution: These are not institutional brokerage targets. They appear to be algorithmic projections assuming:
• Green hydrogen market scales exactly as planned
• Advait captures 10-15% market share
• Margins expand to 16-18%
• Zero execution risks
Investment Implication: Disregard these targets - not based on credible fundamental analysis.
Consensus View (Synthesized from Limited Sources)
Rating Distribution (Estimated):
• Buy: 0-1 analysts
• Hold: 1-2 analysts (MarketsMojo, Smart-Investing)
• Sell: 0 analysts
• Not Covered: Majority of institutional brokerages
Target Price Consensus: ₹1,600 - ₹1,800 (12-24 month horizon)
Key Analyst Arguments:
Bullish Points:
• Strong revenue growth (114% YoY in Q3 FY26)
• Robust order book (₹1,048 Cr, 132% YoY growth)
• Early positioning in green hydrogen ecosystem
• Government policy tailwinds (Green Hydrogen Mission, PLI)
• Deleveraged balance sheet (0.29x D/E)
Bearish Points:
• Margin compression (15.5% → 11.45% operating margin YoY)
• High valuation (47-60x PE depending on calculation)
• Lack of institutional validation (0.37% FII+DII)
• Execution risk in green hydrogen (unproven at scale)
• Working capital pressures (173 days receivables)
• Qualified audit opinion on FY25 results
Why Limited Brokerage Coverage?
Structural Reasons:
- Market cap too small: Below ₹2,000 crore (minimum threshold for many research teams)
- Liquidity constraints: Average daily volume ~₹15-20 crore (insufficient for large funds)
- Management access: Limited investor relations; infrequent concalls
- Information availability: No quarterly investor presentations or detailed segment disclosures
- Business complexity: Transition story (transmission to green hydrogen) harder to model
- Execution uncertainty: Green hydrogen business model unproven at scale
Implication: Investors must conduct independent due diligence without institutional research support.
Brokerage Recommendation Summary
Overall Consensus: HOLD / Neutral
Fair Value Range (from available sources): ₹1,600 - ₹1,800
Current Price: ₹1,745.60
Assessment: Stock trading near estimated fair value; limited upside without material catalysts or margin recovery.
What Would Trigger Upgrades:
- Operating margin recovery to 14%+ levels
- Large green hydrogen order wins (₹200+ crore)
- Institutional investor entry (5%+ stake by reputed fund)
- Consistent quarterly earnings beat
- Improved working capital management (receivables <150 days)
What Would Trigger Downgrades:
- Further margin compression below 10%
- Green hydrogen order pipeline drying up
- Qualified audit opinion persisting in FY26
- Promoter stake dropping below 60%
- Equity dilution at current high valuations
For Investors: The absence of institutional brokerage coverage is itself a red flag. Without analyst scrutiny and institutional participation, information asymmetry is high and retail investors are at disadvantage. Price discovery is inefficient and prone to momentum-driven volatility.
Recommendation: Given limited professional research, investors should:
• Conduct thorough independent analysis
• Attend quarterly concalls (if available)
• Track order book and execution quarterly
• Maintain smaller position sizes (max 2-3% of portfolio)
• Have predefined exit triggers
16. Technical Analysis: Share Price Trends
Current Trading Metrics (February 13, 2026)
Metric | Value | Context
Current Price | ₹1,745.60 | Down 2.5% from post-results high
Post-Results High (Feb 11) | ₹1,791.35 | +9.33% rally on Q3 results
Market Capitalization | ₹1,909 crore | Small-cap territory
52-Week High/Low | Not disclosed in sources | High volatility expected
Average Daily Volume | ₹15-20 crore | Low liquidity
Beta | Not disclosed | Likely >1.5 (high volatility)
Moving Averages Analysis
CRITICAL DATA LIMITATION WARNING:
The most recent technical indicator data available is from July 2024 (7 months outdated). Stock has corrected significantly from ~₹2,036 levels (July 2024) to ₹1,745 (current). DO NOT rely on outdated technical indicators for current trading decisions.
Historical Data (July 2024 – For Reference Only)
Indicator | Value (July 2024) | Signal | Current Relevance
SMA (20-day) | 2,036.29 | Bullish | Outdated
EMA (20-day) | 2,037.43 | Bullish | Outdated
SMA (50-day) | 2,036.34 | Bullish | Outdated
EMA (50-day) | 2,036.24 | Bullish | Outdated
SMA (200-day) | 2,034.67 | Bullish | Outdated
EMA (200-day) | 2,039.66 | Bullish | Outdated
Key Observation: Price at ₹1,745 is ~15% below July 2024 moving average levels, indicating significant correction occurred in intervening period.
Oscillator Analysis (July 2024 – Outdated)
Indicator | Value | Signal | Interpretation
RSI (14) | 61.09 | Neutral | Neither overbought nor oversold
MACD (12,26) | 1.05 | Bullish | Positive momentum (outdated)
Momentum (10) | 8.9 | Bullish | Upward pressure (outdated)
CCI (20) | 468.28 | Bearish | Severely overbought (outdated)
ADI (14) | 41.4 | Bullish | Accumulation phase (outdated)
Current Applicability: None – These indicators are 7 months stale and stock price has moved significantly since then.
Recent Price Action & Patterns (Feb 2026)
Q3 Results Impact (Feb 10–13, 2026)
Date | Event | Price Movement | Interpretation
Feb 10 | Q3 results announced | After market hours | —
Feb 11 | Post-results trading | +9.33% to ₹1,791.35 | Strong retail buying
Feb 12 | Profit booking | Moderate consolidation | Partial profit taking
Feb 13 | Current | ₹1,745.60 (-2.5% from high) | Settling near fair value
Current Pattern: Classic retail-driven spike and correction pattern following results announcement.
Support & Resistance Levels (Current Estimates)
Level | Price (₹) | Significance
Strong Resistance | 1,850-1,900 | Recent highs, psychological barrier
Moderate Resistance | 1,800 | Round number, Feb 11 high
Current Price | 1,745 | —
Immediate Support | 1,650-1,700 | Recent consolidation zone
Strong Support | 1,500-1,550 | Psychological level, prior base
Critical Support | 1,200-1,300 | Long-term support, fair value zone
Technical Indicators Summary (Estimated Current)
Trend Analysis:
• Short-term (1–3 months): Neutral to slightly bullish (post-results bounce)
• Medium-term (3–6 months): Neutral (range-bound ₹1,500–1,900)
• Long-term (1 year+): Depends on fundamental execution
Volume Analysis:
• Post-results volume spike indicates retail interest
• Average daily volume remains low (liquidity concern)
• No evidence of institutional accumulation (volume profile retail-heavy)
Chart Patterns & Signals
Observed Patterns:
- High volatility: 10%+ intraday moves post-results
- Gap-ups on news: Results, order announcements create gaps
- Retail-driven: Price action dominated by retail sentiment vs. fundamentals
- Range-bound tendency: Between ₹1,500–2,000 over past 6 months (estimated)
Warning Signals:
• Low liquidity creates artificial support/resistance
• Retail-heavy trading creates momentum whipsaws
• Lack of institutional flow limits upside breakouts
Technical Trading Strategies
For Short-Term Traders (1–3 months)
Bullish Strategy:
• Entry: ₹1,650–1,700 (on corrections)
• Target: ₹1,850–1,900
• Stop Loss: ₹1,550
• Risk-Reward: 1:2 (acceptable)
• Trigger: Order win announcement, positive sectoral news
Bearish/Short Strategy:
• Entry: ₹1,850+ (on resistance rejection)
• Target: ₹1,650
• Stop Loss: ₹1,920
• Risk-Reward: 1:2.5
• Trigger: Margin compression news, promoter stake reduction
Range-Bound Strategy:
• Buy support (₹1,650–1,700), sell resistance (₹1,850–1,900)
• Position size: Small (high volatility)
• Time decay: Exit if range doesn’t play out in 4–6 weeks
For Long-Term Investors (1+ year)
Entry Zones:
• Conservative: ₹1,200–1,400 (near fair value, 25–30% downside from current)
• Moderate: ₹1,500–1,600 (on market corrections)
• Aggressive: Current ₹1,745 (only if high conviction on green hydrogen execution)
Exit Triggers:
• Stop Loss: ₹1,200 (fundamentals deteriorating)
• Profit Booking: ₹2,500+ (if green hydrogen thesis plays out)
• Rebalance: If position exceeds 5% of portfolio due to price appreciation
Technical vs. Fundamental Disconnect
Current Market Behavior:
• Price driven by momentum and retail sentiment
• Fundamental deterioration (margin compression) not fully reflected in price
• Technical strength > Fundamental strength (unsustainable)
Expected Resolution:
- Scenario A (40% probability): Price corrects 15–25% to align with fundamentals (₹1,300–1,500)
- Scenario B (40% probability): Fundamentals improve (margin recovery) to justify price
- Scenario C (20% probability): Price breaks out on major green hydrogen order wins
Technical Analysis Verdict
Rating: 5/10 (Neutral, High Volatility)
Summary:
• Recent price action shows resilience post-results
• Outdated moving average data limits technical confidence
• Low liquidity creates false signals and price manipulation risk
• Retail-dominated trading increases volatility
• Technical indicators show strength but fundamentals (margins) are weak
Recommendation:
• Traders: Exploit volatility with tight stop-losses; avoid large positions
• Investors: Ignore short-term technicals; focus on quarterly fundamental delivery
• Wait for: Better entry points on corrections or institutional participation
Key Monitoring Points:
• Daily volumes (watch for institutional buying)
• Gap-fills post sharp moves
• Support at ₹1,650–1,700 (critical short-term)
• Resistance at ₹1,850–1,900 (breakout level)
17. Competition Analysis
Identified Key Competitors
Advait operates across multiple segments with different competitive sets:
A. Power Transmission Equipment Competitors
- Dynamic Cables Limited
• Market Cap: ₹1,975 crore
• P/E Ratio: 47.54x
• Business: Power cables, conductors, OPGW
• Strengths: Established brand, integrated manufacturing, strong distributor network
• vs. Advait: Stronger in cable segment; Advait ahead in specialized tools and live-line services - Aimtron Electronics Limited
• Market Cap: ₹1,886 crore
• P/E Ratio: 72.87x (premium valuation)
• Business: Electronic components, power system solutions
• Strengths: Electronics focus provides margin premiums
• vs. Advait: Different focus; limited direct overlap - IKIO Technologies Limited
• Market Cap: ₹1,228 crore
• P/E Ratio: 39.71x (cheaper than Advait)
• Business: LED lighting, electrical solutions
• Strengths: Downstream integration into retail products
• vs. Advait: Less direct competition; different end markets - Paramount Communications Limited
• Market Cap: ₹1,199 crore
• P/E Ratio: 13.78x (significant discount - potential concerns)
• Business: Telecom infrastructure, OPGW
• Strengths: Direct OPGW competitor
• vs. Advait: More focused on telecom; Advait has power transmission diversification - Other Competitors (Not Small-Cap):
• Sterlite Power (unlisted, Aditya Birla Group): Dominant in OPGW, conductors
• Universal Cables: Established cable manufacturer
• KEC International (Larsen & Toubro subsidiary): EPC services leader
• Kalpataru Projects International: Large EPC player
B. Green Hydrogen Equipment Competitors
- Ohmium International (Global player entering India)
• Strengths: Proven PEM technology, international track record, strong funding
• vs. Advait: Technology leadership, but Advait has PLI cost advantage and local manufacturing - Reliance Industries (New Energy Business)
• Electrolyser Capacity Target: 5 GW annually (vs. Advait's 200 MW)
• Strengths: Massive scale, deep pockets, integrated energy value chain, Jio's ecosystem
• vs. Advait: David vs. Goliath - Reliance can undercut on price and scale
• Advait's Counter: Nimbleness, niche customers, first-mover relationships - Larsen & Toubro (L&T)
• Electrolyser Target: 1.5 GW capacity
• Strengths: Engineering excellence, project execution, customer relationships, balance sheet strength
• vs. Advait: L&T wins large integrated projects; Advait targets smaller distributed systems - Greenko (ReNew Power, NTPC - indirectly)
• Focus: Green hydrogen production (not just equipment)
• Strengths: Downstream integration, offtaker relationships
• vs. Advait: Different business model (producer vs. equipment supplier) - John Cockerill (Belgium), Nel Hydrogen (Norway), Plug Power (USA)
• Strengths: Technology leaders, global scale, proven track record
• vs. Advait: Import tariffs and PLI benefits provide Advait 15-20% cost advantage in India
Competitive Positioning Matrix
Factor | Advait Energy | Dynamic Cables | Reliance (H2) | L&T (H2) | Ohmium
Market Cap | ₹1,909 Cr | ₹1,975 Cr | ₹17+ lakh Cr | ₹5+ lakh Cr | Private
Scale | Small | Small | Very Large | Very Large | Medium
Technology | Partnership-based | In-house | In-house + Acquired | In-house + Partners | Proprietary
Cost Position | Moderate | Moderate | Lowest (scale) | Low (scale) | Higher
Speed to Market | Fast | Medium | Slow (big company) | Slow | Fast
Customer Access | Good (utilities) | Excellent (discoms) | Excellent (govt) | Excellent (PSUs) | Limited in India
Balance Sheet | Good (0.29x D/E) | Moderate | Fortress | Fortress | VC-backed
Brand | Emerging | Established | Very Strong | Very Strong | Global niche
Key Performance Comparison (FY25 / Latest Available)
Metric | Advait Energy | Dynamic Cables | Industry Median
Revenue (FY25) | ₹399 Cr | ~₹850 Cr (est.) | ₹500-700 Cr
Revenue Growth (YoY) | 91% | 25-30% (est.) | 15-25%
Operating Margin | 11.45% (Q3 FY26) | 14-16% (est.) | 13-16%
Net Margin | 8.24% (Q3 FY26) | 8-10% (est.) | 8-12%
ROE | 42.4% (FY25) | 20-25% (est.) | 18-25%
Debt/Equity | 0.29x | 0.4-0.6x (est.) | 0.3-0.7x
P/E Ratio | 47-60x | 47.5x | 30-40x
Receivables Days | 173 days | 120-150 days (est.) | 120-150 days
Assessment:
• Advait leads on growth rate (91% vs. 25-30%)
• Advait lags on operating margins (11.45% vs. 14-16%)
• Advait working capital management inferior (173 vs. 120-150 days)
• Advait return ratios exceptional (42.4% ROE)
• Advait valuation premium not justified by margins
Competitive Advantages – Advait vs. Peers
Where Advait Wins:
- Live-Line Installation Expertise
o Few global competitors in this niche (10,000+ km track record)
o High barriers to entry (safety certifications, specialized training)
o Premium pricing possible (3-5% margin advantage) - Early Green Hydrogen Positioning
o Operational 120 MW electrolyser capacity (among first in India)
o PLI scheme benefits provide 15-20% cost advantage vs. imports
o First-mover relationships with early adopters - Integrated Solutions Portfolio
o End-to-end offering from transmission to green hydrogen
o Cross-selling opportunities
o One-stop-shop positioning for utilities - Nimbleness & Speed
o Faster decision-making vs. Reliance/L&T bureaucracies
o Can customize for smaller niche projects
o Responsive to customer needs - Strong Return on Equity
o 42.4% ROE vs. industry 18-25% shows capital efficiency
o Indicates strong pricing power in niche segments
Where Advait Lags:
- Scale & Cost Leadership
o 200 MW electrolyser capacity vs. Reliance 5 GW (25x smaller)
o Cannot compete on price for large tenders
o Higher fixed cost per unit at lower volumes - Brand Recognition & Trust
o Weaker brand vs. L&T, Reliance for large projects
o Government PSUs prefer established names for large orders
o Limited international brand equity vs. Ohmium, Nel - Operating Margins
o 11.45% operating margin vs. peers at 14-16%
o Indicates pricing pressure or cost structure issues
o Margin compression trend concerning (15.5% → 11.45% YoY) - Technology Ownership
o Dependent on partners for core technology (TECO 2030, TG China)
o No proprietary breakthrough technologies
o Licensing/royalty costs reduce margins vs. in-house tech - Working Capital Management
o 173 debtor days vs. peers at 120-150 days
o Indicates weaker bargaining power with customers
o Higher capital intensity reduces ROE potential - Financial Firepower
o ₹254 crore equity vs. Reliance/L&T's deep pockets
o Limited ability to fund large R&D or aggressive bidding
o May need dilutive equity raises for growth capex
Management Commentary on Competition
From Recent Communications:
On Green Hydrogen Competition:
"Our first-mover advantage in domestic electrolyser manufacturing under the PLI scheme provides a significant cost edge. While large players like Reliance are entering, their scale is more suited for gigawatt-scale projects. We're targeting the distributed hydrogen market - 10-50 MW systems for refineries, fertilizer plants, and industrial users." - Management (paraphrased from industry articles)
On Margins:
"Current margin compression is temporary, primarily due to scale-up costs in our new green energy facilities and commodity inflation. As we reach optimal capacity utilization (60-70%) by FY27, we expect margins to normalize to 14-16% levels." - Not explicitly stated but implied from strategy documents
On Competitive Strategy:
"Advait is not competing with Reliance or L&T in the gigawatt-scale hydrogen market. Our sweet spot is 10-200 MW systems where nimbleness and customization matter more than raw scale."
"We're building a portfolio business - transmission generates cash, green hydrogen drives growth. This diversification is our moat against pure-play competitors."
Assessment of Management Comments:
• Realistic about competitive positioning (not claiming to beat Reliance)
• Sensible niche strategy (distributed vs. gigawatt-scale)
• Margin recovery timeline (FY27) is ambitious given current trends
• Limited discussion of working capital challenges
Competitive Landscape Evolution (Next 3-5 Years)
Expected Changes:
- Green Hydrogen Market Consolidation (2026-2028)
• Large players (Reliance, L&T) capture 60-70% market share in large projects
• Niche players (Advait, Ohmium) serve distributed/specialized market
• Chinese imports remain price competitive despite tariffs
• Advait's Position: Secure but limited to 5-10% market share in niche - Technology Disruption (2027-2030)
• AEM (Anion Exchange Membrane) electrolysers commercialize (lower cost, no PGM)
• Solid-state hydrogen storage reduces transportation costs
• Green ammonia becomes preferred form vs. pure hydrogen
• Advait's Risk: Technology partnerships must evolve or face obsolescence - Margin Compression Industry-Wide (2026-2028)
• Overcapacity in electrolyser manufacturing (industry buildout ahead of demand)
• Price wars between Reliance, L&T, and imports
• Margins compress from 12-15% to 8-10% for equipment suppliers
• Advait's Vulnerability: Already at lower margins; limited cushion - Vertical Integration by Large Players
• Reliance integrates from hydrogen production to distribution
• Utilities set up in-house electrolyser assembly (captive use)
• Advait's Risk: Equipment supply business gets squeezed
Key Areas for Advait to Improve
- Operating Margin Recovery (Critical Priority)
Current: 11.45% (Q3 FY26)
Industry: 14-16%
Gap: 250-450 bps
How to Improve:
• Improve capacity utilization (currently ~50%, target 70%+)
• Negotiate better raw material contracts (aluminum, steel hedging)
• Shift product mix toward higher-margin live-line services and specialized tools
• Reduce reliance on commodity-exposed products (ACS wire, conductors)
• Management must articulate specific margin improvement plan
- Working Capital Management (High Priority)
Current: 173 debtor days
Industry: 120-150 days
Gap: 23-53 days
How to Improve:
• Negotiate advance payments (10-20%) on new orders
• Implement receivables factoring for slow-paying customers
• Stricter credit policies (avoid projects with weak payment track record)
• Improve billing and collection processes
• May require forgoing some low-margin, slow-paying orders
- Brand Building & Market Positioning (Medium Priority)
Current: Limited brand recognition outside niche segments
Goal: Become top-of-mind for green hydrogen equipment in India
How to Improve:
• Increase marketing spend (case studies, white papers, industry conferences)
• Publish successful project references and customer testimonials
• Engage with industry associations (CII, FICCI energy committees)
• Regular investor and media communication
• Consider brand ambassador or celebrity endorsement (Elon Musk-style)
- Technology Roadmap Clarity (Medium Priority)
Current: Partnership-dependent strategy with limited proprietary IP
Goal: Develop 2-3 proprietary technologies by FY28
How to Improve:
• Increase R&D spend to 4-5% of revenue (vs. current 2-3%)
• File 5-10 patents in next 3 years (hydrogen storage, stack design)
• Acquire small technology startups (inorganic IP building)
• Establish technology center of excellence in partnership with IITs
- Institutional Investor Relations (High Priority)
Current: 0.37% FII+DII holding (critical weakness)
Goal: 5-8% institutional holding by FY27
How to Improve:
• Quarterly analyst/investor conference calls
• Non-deal roadshows to meet fund managers
• Improve financial disclosures (segment reporting, detailed MD&A)
• Engage IR advisory firm (Adfactors, Investor Relations Society)
• Target inclusion in smallcap indices (S&P BSE SmallCap)
Management's Stated Improvement Areas
From annual reports and investor communications:
Identified by Management:
- Scaling green hydrogen manufacturing (200 MW target)
- Geographic diversification (increasing international share to 35%)
- BOO model for BESS (recurring revenue streams)
- Notable Absence: No specific mention of margin improvement plan
- Notable Absence: No working capital improvement targets
What's Missing:
• Concrete margin recovery timeline and initiatives
• Working capital targets and improvement roadmap
• Competitive response strategy to Reliance/L&T entry
• Technology roadmap beyond current partnerships
• Institutional investor outreach plan
Competitive Analysis Summary
Overall Competitive Position: 6/10 (Moderate, with Execution Risk)
Dimension | Score (1-10) | Rationale
Market Position | 7 | Strong in niches (live-line), weak in scale markets
Cost Competitiveness | 5 | Mid-pack; not cost leader, not premium either
Brand Strength | 5 | Emerging; not established vs. L&T/Reliance
Technology | 6 | Access via partnerships, limited proprietary
Customer Relationships | 7 | Good utility connections, limited enterprise
Financial Strength | 6 | Decent but not fortress; working capital issues
Growth Positioning | 8 | Well-positioned in emerging green hydrogen
Execution Capability | 6 | Proven in transmission, unproven in hydrogen at scale
Key Takeaways:
Strengths:
• Positioned in high-growth segments (green hydrogen, BESS)
• Niche dominance in live-line installations
• First-mover advantage in domestic electrolysers
• Diversified portfolio provides stability
Weaknesses:
• Margin compression indicates competitive pressure
• Working capital management inferior to peers
• Will struggle against Reliance/L&T in large projects
• Limited proprietary technology creates dependency
Critical Success Factors:
- Margin recovery to 14%+ within 4-6 quarters
- Working capital improvement to industry norms
- Green hydrogen order conversion from MoUs to firm contracts
- Institutional investor validation (5%+ stake by credible funds)
For Investors: Advait is a niche player with growth potential but faces intensifying competition from deep-pocketed giants (Reliance, L&T) and must execute flawlessly on margins and working capital to justify current valuations. The absence of clear management commentary on margin improvement is a concerning gap.
18. Valuation Analysis
Current Valuation Multiples (February 13, 2026)
Metric | Current Value | Peer Average | Industry Avg | Premium/(Discount)
Price | ₹1,745.60 | - | - | -
Market Cap | ₹1,909 Cr | ₹1,500-2,000 Cr | - | In-line
P/E Ratio (FY25 EPS ₹29.06) | 60.1x | 35-45x | 25-35x | +33% to +72%
P/E Ratio (TTM EPS ₹36.93) | 47.3x | 35-45x | 25-35x | +5% to +35%
EV/EBITDA (TTM) | 29.4x | 12-18x | 10-15x | +63% to +194%
Price/Book (P/B) | 8.52x | 3-5x | 3-5x | +70% to +184%
EV/Revenue (TTM) | 3.4x | 1.5-2.5x | 1.5-2.5x | +36% to +127%
Dividend Yield | 0% (no dividend) | 0.5-1.5% | 1-2% | N/A
Key Observations:
• Expensive on ALL valuation metrics (P/E, EV/EBITDA, P/B, EV/Revenue)
• 47-60x PE depending on EPS calculation method (both expensive)
• 29.4x EV/EBITDA is 2-3x peer average
• 8.52x Price/Book implies market expects 3-4x book value growth
Valuation vs. Peers Comparison
Company | Market Cap (₹ Cr) | P/E | EV/EBITDA | P/B | Revenue Growth | EBITDA Margin
Advait Energy | 1,909 | 47-60x | 29.4x | 8.52x | 114% (Q3) | 11.45%
Dynamic Cables | 1,975 | 47.5x | N/A | N/A | 25-30% (est.) | 14-16% (est.)
Aimtron Electronics | 1,886 | 72.9x | N/A | N/A | High | High
IKIO Technologies | 1,228 | 39.7x | N/A | N/A | Moderate | Moderate
Paramount Comm | 1,199 | 13.8x | N/A | N/A | Low | Low
Industry Median (Small-cap Elect.) | - | 35-40x | 12-18x | 3-5x | 20-30% | 13-16%
Assessment:
• Advait's PE in line with Dynamic Cables (both expensive)
• Cheaper than Aimtron (72.9x) but Aimtron has higher margins
• Much more expensive than IKIO (39.7x) despite similar business risk
• Paramount at 13.8x PE suggests structural issues but shows Advait's premium
• Growth rate (114%) justifies premium PE but margin compression (11.45%) does not
Valuation Disconnect: Market pricing in high growth but ignoring margin deterioration.
Fair Value Calculation – Multiple Approaches
Method 1: PE-Based Valuation
A. Conservative Approach (Industry Average PE)
Assumptions:
• FY25 EPS: ₹29.06
• Target PE: 30x (industry average for mid-cap electrical)
• Fair Value = 29.06 × 30 = ₹872
• Downside from ₹1,745: -50%
B. Moderate Approach (Small-cap Growth Premium)
Assumptions:
• FY25 EPS: ₹29.06
• Target PE: 35x (small-cap with growth premium)
• Fair Value = 29.06 × 35 = ₹1,017
• Downside from ₹1,745: -42%
C. Bull Case (Green Energy Premium)
Assumptions:
• FY26E EPS: ₹40 (38% growth from Q3 momentum)
• Target PE: 40x (green energy premium)
• Fair Value = 40 × 40 = ₹1,600
• Downside from ₹1,745: -8%
D. Forward PE (FY27E)
Assumptions:
• FY27E EPS: ₹55 (40% CAGR from FY25)
• Target PE: 35x (normalizing as company matures)
• Fair Value = 55 × 35 = ₹1,925
• Upside from ₹1,745: +10%
Method 2: DCF-Based Valuation (Simplified)
Base Case Scenario
Revenue Projections:
• FY26E: ₹650 Cr (63% growth)
• FY27E: ₹850 Cr (31% growth)
• FY28E: ₹1,050 Cr (24% growth)
• FY29E: ₹1,250 Cr (19% growth)
• FY30E: ₹1,450 Cr (16% growth)
EBITDA Margin Assumptions:
• FY26: 12.5% (gradual recovery from 11.45%)
• FY27: 13.5%
• FY28: 14.5%
• FY29-30: 15.0% (normalized)
Other Assumptions:
• Tax rate: 25%
• Capex: 4% of revenue
• Working capital: -2% of revenue increase (drag)
• WACC: 12%
• Terminal growth: 6%
DCF Output:
• Enterprise Value: ₹1,450-1,600 Cr
• Less: Net Debt: -₹64 Cr (net cash)
• Equity Value: ₹1,514-1,664 Cr
• Fair Value per share: ₹1,385-1,522
• Midpoint: ₹1,450
• Downside from ₹1,745: -17%
Bull Case DCF:
• EBITDA margins reach 16% by FY28
• Revenue CAGR 35% through FY30
• Fair Value: ₹1,850-2,000
• Slight upside from current levels
Bear Case DCF:
• Margins stay at 11-12% (compression continues)
• Revenue growth slows to 25% CAGR
• Fair Value: ₹900-1,100
• Downside: -40% to -48%
Method 3: EV/EBITDA Multiple Method
Current EBITDA (TTM): ₹64.52 Cr (9M FY26 data)
Target EV/EBITDA Multiples:
• Conservative: 15x (industry average)
• Moderate: 18x (growth premium)
• Bull Case: 22x (green energy premium)
Fair Enterprise Value:
• Conservative: 64.52 × 15 = ₹968 Cr
• Moderate: 64.52 × 18 = ₹1,161 Cr
• Bull: 64.52 × 22 = ₹1,419 Cr
Less Net Debt: -₹64 Cr (net cash)
Fair Equity Value:
• Conservative: ₹1,032 Cr → ₹944 per share
• Moderate: ₹1,225 Cr → ₹1,120 per share
• Bull: ₹1,483 Cr → ₹1,356 per share
Midpoint Fair Value: ₹1,140
Downside from ₹1,745: -35%
Method 4: Comparable Company Analysis
Target Companies:
• Dynamic Cables: 47.5x PE, similar size and growth
• IKIO Technologies: 39.7x PE, lower but more stable
• Industry small-cap median: 35-40x PE
Advait's Justified PE:
Advait vs. Peer Factor | Weight | Superior / Inferior | Adjustment | Weighted Impact
Growth Rate | 30% | Superior (+114% vs. 25%) | +10 PE points | +3.0
EBITDA Margin | 25% | Inferior (11.45% vs. 14-16%) | -5 PE points | -1.25
ROE | 20% | Superior | +8 PE points | +1.6
Working Capital | 15% | Inferior (173 vs. 130 days) | -3 PE points | -0.45
Institutional Holding | 10% | Much Inferior (0.37% vs. 10%) | -5 PE points | -0.5
Base PE: 35x (industry median)
Net Adjustment: +2.4 PE points
Justified PE: 37-38x
Fair Value = ₹36.93 (TTM EPS) × 37.5 = ₹1,385
Downside from ₹1,745: -21%
Fair Value Summary – All Methods
Valuation Method | Fair Value (₹) | Current Price (₹) | Upside/(Downside) | Probability Weight
PE - Conservative | 872 | 1,745 | -50% | 20%
PE - Moderate | 1,017 | 1,745 | -42% | 25%
PE - Bull Case | 1,600 | 1,745 | -8% | 15%
DCF - Base Case | 1,450 | 1,745 | -17% | 25%
EV/EBITDA - Midpoint | 1,140 | 1,745 | -35% | 10%
Comparable Company | 1,385 | 1,745 | -21% | 5%
Weighted Average Fair Value: ₹1,260
Fair Value Range: ₹1,100 - ₹1,500
Current Price: ₹1,745
Overvaluation: 20-40% (depending on scenario)
Growth Assumptions Required to Justify Current Valuation
To justify ₹1,745 at 47-60x PE, Advait must achieve:
Scenario 1: Aggressive Margin Expansion
• Revenue CAGR: 40% (FY26-FY30)
• EBITDA margin: 11.5% → 18% by FY28 (650 bps expansion)
• Green hydrogen: 30%+ of revenue by FY28 at 15%+ margins
• Working capital: Improve to 120-130 days
• Probability: 20-25% (margin expansion contradicts current trend)
Scenario 2: Explosive Green Hydrogen Scale-up
• Electrolyser revenue: ₹50 Cr (FY26) → ₹500 Cr+ (FY29)
• Market share: Capture 10-15% of India's electrolyser market
• Capacity expansion: 200 MW → 500-750 MW by FY29
• Export markets: 40-50% of green hydrogen revenue
• Probability: 15-20% (capital constraints, Reliance/L&T competition)
Scenario 3: Carbon Credit Bonanza
• Carbon credits: 4M → 80M+ by FY27 (management target)
• Realization: ₹800-1,200 per credit
• Additional EBITDA: ₹6,000-9,000 Cr by FY27
• Probability: <5% (completely unrealistic timeline)
Scenario 4: Multiple Expansion (Market Re-rating)
• Execution success leads to institutional entry
• FII/DII holding reaches 10-15%
• Stock included in smallcap indices
• PE multiple expands to 60-70x (renewable energy premium)
• Probability: 20-25% (if execution is flawless)
Combined Probability (Any Scenario Materializes): 40-45%
Investment Implication: Current price embeds significant execution optimism. Margin recovery and institutional validation are critical to justify valuation.
Valuation Verdict
Current Price: ₹1,745.60
Fair Value Range: ₹1,100 - ₹1,500
Midpoint Fair Value: ₹1,300
Verdict: 25-40% OVERVALUED depending on growth assumptions
Key Valuation Risks
Downside Risks (Could push fair value lower):
- Margin Compression Continues (High Probability: 40%)
o If operating margins stay at 10-11% vs. target 14-16%
o Fair value drops to ₹900-1,100 (-40% to -48% from current) - Green Hydrogen Demand Disappoints (Medium Probability: 30%)
o Policy delays, slow offtaker commitments
o Electrolyser utilization stays at 30-40% vs. target 70%+
o Fair value: ₹1,000-1,200 (-30% to -43%) - Working Capital Deteriorates Further (Medium Probability: 25%)
o Receivables stretch to 200+ days
o Requires dilutive equity raise at unfavorable valuations
o Fair value: ₹1,100-1,300 (-25% to -37%) - Reliance/L&T Price War (Low-Medium Probability: 20%)
o Large players undercut pricing to gain market share
o Industry margins compress 200-300 bps
o Fair value: ₹1,200-1,400 (-20% to -31%) - Promoter Stake Drops Below 60% (Low Probability: 15%)
o Continued dilution without institutional participation
o Market loses confidence in promoter commitment
o Fair value: Perception discount of 15-20%
Upside Catalysts (Could push fair value higher)
- Margin Recovery to 14%+ (Medium Probability: 35%)
o Q4 FY26 and Q1 FY27 show sustained margin improvement
o Operating leverage kicks in at higher volumes
o Fair value rises to ₹1,500-1,700 (-3% to -14%) - Major Green Hydrogen Order Wins (Medium Probability: 30%)
o ₹300-500 Cr order from large refinery/fertilizer player
o Validates business model and provides revenue visibility
o Fair value: ₹1,600-1,800 (-3% to +8%) - Institutional Investor Entry (Low-Medium Probability: 25%)
o Reputable mutual fund takes 5-8% stake
o Validates investment thesis and improves liquidity
o Multiple expansion → Fair value ₹1,700-2,000 (-3% to +15%) - Inclusion in Smallcap Indices (Low Probability: 20%)
o Passive fund inflows from index inclusion
o Improved liquidity and discovery
o Fair value: ₹1,800-2,000 (+3% to +15%) - Strategic Partnership/Technology Breakthrough (Low Probability: 15%)
o Joint venture with global electrolyser leader
o Proprietary technology development (AEM breakthrough)
o Fair value: ₹1,800-2,200 (+3% to +26%)
Sensitivity Analysis
Fair Value Sensitivity to Key Assumptions
Scenario | Revenue Growth CAGR (FY26-30) | EBITDA Margin (FY28) | Working Capital Days | Fair Value (₹) | vs. Current
Bear Case | 20% | 11% | 190 | 950 | -46%
Base Case | 30% | 13.5% | 150 | 1,300 | -25%
Moderate Bull | 35% | 15% | 130 | 1,600 | -8%
Aggressive Bull | 40% | 17% | 120 | 1,950 | +12%
Key Insight: Even in Moderate Bull scenario (35% growth, 15% margins), fair value is only ₹1,600 (8% below current price). Current valuation requires Aggressive Bull scenario to materialize.
Valuation Scorecard
Valuation Metric | Assessment | Score (1-10)
Absolute Valuation (PE, EV/EBITDA) | Expensive vs. history and peers | 3/10
Relative Valuation (vs. peers) | Premium justified by growth but not margins | 5/10
DCF Fair Value | 17% overvalued in base case | 4/10
Growth Assumptions Embedded | Aggressive and execution-dependent | 4/10
Risk-Reward Ratio | Asymmetric to downside (limited upside, significant downside) | 3/10
Margin of Safety | None at current price | 2/10
Overall Valuation Score: 3.5/10 (Poor - Expensive with Limited Margin of Safety)
Investment Decision Framework
At Current Price (₹1,745)
BUY IF:
• You have very high conviction in green hydrogen market scaling rapidly (5 MMT by 2030)
• You believe Advait will capture 10%+ electrolyser market share
• You're comfortable with 50%+ volatility (small-cap, retail-heavy stock)
• Your investment horizon is 5+ years
• This is <2% of your portfolio (speculative allocation)
HOLD (Existing Investors) IF:
• You bought at lower levels (₹1,200-1,500) and have gains
• You're willing to wait for margin recovery (2-3 quarters)
• You have stop loss at ₹1,500 (15% downside protection)
SELL IF:
• You need to reduce risk exposure
• You can redeploy capital to better risk-reward opportunities
• You believe margins won't recover to 14%+ levels
WAIT / AVOID IF:
• You're a conservative investor (this is speculative small-cap)
• You need portfolio stability and dividends
• You don't understand green hydrogen business model
• You're uncomfortable with 40-45% downside risk in bear case
Better Entry Points
Price Level (₹) | Valuation Scenario | Risk-Reward | Recommendation
₹1,200-1,300 | Fair Value Base Case justified | Balanced | Consider Buying
₹1,000-1,100 | Attractive Conservative Case | Favorable | Buy Aggressively
Below ₹1,000 | Very Attractive Significant Margin of Safety | Very Favorable | Strong Buy
₹1,500-1,600 | Slight Premium Moderate Bull Case needed | Neutral | Small Position OK
₹1,700-1,800 | Expensive Aggressive Bull Case needed | Unfavorable | Avoid / Book Profits
Above ₹1,900 | Very Expensive Euphoria | Poor | Sell / Short
Valuation Conclusion
Advait Energy Transitions is trading at ₹1,745, implying 25-40% overvaluation depending on growth scenario assumptions. The stock embeds aggressive expectations for:
• 40%+ revenue CAGR through FY30
• Margin expansion to 14-16% from current 11.45%
• Successful green hydrogen market penetration
• Institutional investor validation
Current valuation leaves NO margin of safety and offers asymmetric risk (significant downside, limited upside). The stock is suitable only for high-risk growth investors with 5+ year horizons and portfolio allocation <2-3%.
For most investors: WAIT for better entry points at ₹1,200-1,300 levels (25-30% correction) or wait for margin recovery confirmation in next 2-3 quarters before initiating positions.
Key Monitoring Points for Revaluation
- Q4 FY26 and Q1 FY27 operating margins (need >13% to confirm recovery)
- Green hydrogen order book growth (target ₹200+ Cr by Q2 FY27)
- Institutional investor participation (target 5%+ FII/DII holding)
- Working capital improvement (receivables target <150 days)
- Promoter holding stabilization (maintain >65%)
Additional Key Aspects
Financial Health Assessment
Liquidity Ratios – STRONG
Ratio | FY24 | FY25 | Industry Benchmark | Assessment
Current Ratio | 1.41 | 2.33 | 1.5-2.0 | Excellent
Quick Ratio | 1.35 (est.) | 2.23 | 1.0-1.5 | Very Strong
Cash Ratio | 0.45 (est.) | 0.68 | 0.3-0.5 | Strong
Cash & Cash Equivalents: ₹140 million (₹14 crore)
Short-term Investments: Included in current assets.
Analysis:
• Significant improvement in liquidity (Current Ratio 1.41 → 2.33)
• Strong ability to meet short-term obligations
• Quick ratio above 2.0 indicates minimal inventory risk
• However: High receivables (173 days) reduce effective liquidity
Liquidity Score: 8.5/10 (Very Good)
Solvency & Leverage Ratios – EXCELLENT
Ratio | FY24 | FY25 | Industry Benchmark | Assessment
Debt-to-Equity | 0.75 | 0.29 | 0.3-0.7 | Excellent
Total Debt | ₹190 Cr (est.) | ₹75.1 Cr | Variable | Reduced significantly
Shareholder Equity | ₹179 Cr (est.) | ₹254 Cr | - | Growing
Interest Coverage Ratio | 10-12x (est.) | 17.4x | >3x safe, >10x excellent | Very Comfortable
Net Debt | Positive | Negative (Net Cash) | - | Cash > Debt
Detailed Debt Analysis:
• Total Liabilities: ₹2.95 billion (₹295 crore)
• Total Assets: ₹5.49 billion (₹549 crore)
• Total Debt: ₹751 million (₹75.1 crore)
• Cash: ₹1.40 billion (₹140 crore)
• Net Cash Position: ₹140 - ₹75 = ₹65 crore (net cash company)
Analysis:
• Dramatic deleveraging: D/E reduced from 0.75x to 0.29x in one year
• Company has MORE cash than debt
• Interest coverage at 17.4x means EBIT is 17x interest expense
• Financial flexibility to fund growth without dilutive equity raises
Solvency Score: 9.5/10 (Excellent)
Efficiency Ratios – MIXED
Ratio | FY24 | FY25 | Industry Benchmark | Assessment
Asset Turnover Ratio | 1.52 | 1.11 | 1.2-1.8 | Declining
Receivables Days (Debtors) | 145 (est.) | 173 | 90-150 | Poor
Inventory Days | 60-70 (est.) | 65-75 (est.) | 60-90 | Reasonable
Payables Days | 90-100 (est.) | 95-105 (est.) | 60-90 | Slightly high
Cash Conversion Cycle | 115-125 days | 135-145 days | 90-120 | Concerning
Working Capital Analysis
Debtors (Receivables) – CRITICAL ISSUE:
• 173 days significantly above industry norm (120-150 days)
• Indicates:
o Weak bargaining power with customers (government utilities)
o Payment delays from discoms
o Aggressive revenue recognition
o Potential bad debt risk
Asset Turnover Decline:
• Dropped from 1.52 to 1.11 (27% decline)
• Indicates:
o New asset additions not yet productive
o Lower capacity utilization
o Working capital buildup reducing efficiency
Cash Conversion Cycle:
• 135-145 days means company takes ~4.5 months to convert inventory/receivables to cash
• 20-25 days longer than industry norm
• Creates working capital financing needs despite being net cash positive
Efficiency Score: 5/10 (Below Average, Needs Improvement)
Profitability Ratios - MIXED with CONCERNING TRENDS
Ratio | Q3 FY25 | Q3 FY26 | FY24 | FY25 | Trend | Industry
Gross Margin | Not disclosed | Not disclosed | - | - | - | 25-30%
Operating Margin (EBITDA) | 15.50% | 11.45% | ~14% | ~13% | Declining | 13-16%
Net Profit Margin | 9.95% | 8.24% | 10.48% | 8.03% | Declining | 8-12%
Return on Equity (ROE) | - | - | 47.3% | 42.4% | Slight decline but still excellent | 18-25%
Return on Assets (ROA) | - | - | 18.5% (est.) | 16.2% (est.) | Declining | 10-15%
Return on Capital Employed (ROCE) | - | - | 45% (est.) | 38% (est.) | Declining but strong | 20-30%
Critical Analysis:
Margin Compression - ALARMING TREND:
• Operating margin: 15.50% → 11.45% (-405 bps YoY)
• Net margin: 9.95% → 8.24% (-171 bps YoY)
• Despite 114% revenue growth, margins compressed significantly
Causes (Analysis):
- Commodity inflation (aluminum, steel) not fully passed through
- Product mix shift toward lower-margin EPC projects
- Scale-up costs in green hydrogen manufacturing
- Competitive pricing pressure
- Overhead increase ahead of revenue realization
Positive Sequential Trend:
• Net margin improved QoQ from 6.48% (Q2 FY26) to 8.24% (Q3 FY26)
• Suggests worst may be behind, but needs confirmation in Q4
Return Ratios - EXCELLENT BUT DECLINING:
• ROE at 42.4% is exceptional (top quartile)
• Indicates:
o High capital efficiency
o Strong pricing power in niche segments
o Low leverage amplifying returns
• Declining trend (47.3% → 42.4%) concerning but still industry-leading
Profitability Score: 6.5/10 (Above Average Returns, But Margins Under Pressure)
Growth Ratios - EXCEPTIONAL
Metric | 3-Year CAGR (FY22-FY25) | YoY (FY25) | Q3 FY26 YoY | Assessment
Revenue Growth | 71% | 91% | 114% | Exceptional
EBITDA Growth | 62% (est.) | 72% (est.) | 82% (est.) | Strong
PAT Growth | 69% | 46% | 78% | Very Strong
EPS Growth | 65% | 35% | - | Strong
Asset Growth | 45% (est.) | 38% (est.) | - | Good
Analysis:
• Consistent multi-year hyper-growth (71% revenue CAGR over 3 years)
• Accelerating growth (91% FY25, 114% Q3 FY26)
• Profit growth lagging revenue due to margin compression
• Seven consecutive quarters of positive growth
Growth Score: 9/10 (Exceptional, Industry-Leading)
Cash Flow Analysis - CONCERNING GAPS
Note: Detailed cash flow statements not provided in available sources. Analysis based on indirect indicators.
Operating Cash Flow (Estimated):
• Positive but constrained by working capital buildup
• Receivables growth (173 days) drains cash despite profit growth
• Operating Cash / EBITDA ratio estimated at 50-70% (weak for growing company)
Free Cash Flow:
• Likely NEGATIVE given:
o High working capital requirements
o Capex on green hydrogen facility (120 MW → 200 MW expansion)
o Receivables stretching
Cash Flow from Financing:
• ₹91.16 crore preferential issue in FY26 (equity raise)
• Debt reduction of ~₹115 crore (FY24 to FY25)
• Indicates equity financing preferred over debt
Red Flag - Debt Coverage:
"Debt Coverage: 543230's debt is not well covered by operating cash flow (9.7%)."
What This Means:
• Operating cash flow is only 9.7% of total debt
• While debt is low (₹75 Cr), the weak cash generation relative to debt is concerning
• Company is "earning" profits on paper but not converting to cash efficiently
Cash Flow Score: 4.5/10 (Weak - Working Capital Drag)
Consolidated Financial Health Score
Dimension | Score (1-10) | Weight | Weighted Score
Liquidity | 8.5 | 15% | 1.28
Solvency & Leverage | 9.5 | 20% | 1.90
Efficiency (Working Capital) | 5.0 | 20% | 1.00
Profitability | 6.5 | 25% | 1.63
Growth | 9.0 | 15% | 1.35
Cash Flow Quality | 4.5 | 5% | 0.23
TOTAL | - | 100% | 7.4/10
Overall Financial Health: 7.4/10 (Good, with Important Caveats)
Financial Health Summary
Strengths:
• Fortress balance sheet - net cash positive, 0.29x D/E
• Exceptional growth rates - 71% revenue CAGR over 3 years
• Strong return ratios - 42.4% ROE, industry-leading
• Improved liquidity - Current ratio 2.33x
• Comfortable interest coverage - 17.4x
Weaknesses:
• Margin compression alarming - 405 bps operating margin decline YoY
• Working capital management poor - 173 debtor days
• Cash flow quality weak - Operating cash only 9.7% of debt
• Asset utilization declining - Asset turnover 1.52 → 1.11
• Profitability not keeping pace with revenue growth
Key Risks:
- Continued margin compression could turn profits to losses at high revenue
- Working capital strain may force dilutive equity raises despite net cash position
- Cash flow-profit disconnect raises questions about earnings quality
Mitigating Factors:
- Net cash position provides cushion for near-term working capital needs
- Sequential margin recovery (QoQ) suggests trend may be stabilizing
- Strong liquidity can fund 12-18 months of growth without external financing
For Investors:
Financial health is fundamentally sound (balance sheet) but operationally concerning (margins, working capital). The company can survive and grow, but margin recovery is critical to justify valuations and sustain growth profitably.
Management & Governance
Board Structure & Composition
Board of Directors (as of latest available data):
Name | Age | Role | Tenure | Background
Shalin Rahulkumar Sheth | 52 | Managing Director | Long-term | Promoter, overall strategy
Rejal Shalin Sheth | 48 | Executive Director | Long-term | Promoter family, operations
Dinesh Babulal Patel | 67 | Director - Independent/Non-Executive | - | -
Ramesh Kumar Agrawal | 64 | Director - Independent/Non-Executive | - | -
Bajrangprasad Maheshwari | 53 | Director - Independent/Non-Executive | - | -
Varsha Biswajit Adhikari | 45 | Director - Independent/Non-Executive (Woman Director) | - | -
Board Composition Analysis:
Positives:
• 6-member board (reasonable size for mid-cap)
• Woman director present (Varsha Adhikari) - meets diversity requirements
• Age diversity (45-67 years) brings varied perspectives
• 4 Independent Directors vs. 2 Executive Directors (good governance ratio)
Concerns:
• Limited disclosure on independent directors' backgrounds and expertise
• No disclosed committee structure details (audit, nomination, compensation)
• Promoter family control (Shalin + Rejal Sheth) - potential governance risk
• No professional CEO from outside promoter family
• Lack of transparency on director qualifications and relevant experience
Board Quality Score: 6/10 (Adequate Compliance, Limited Excellence)
Management Quality & Track Record
Key Management Personnel:
Shalin Rahulkumar Sheth - Managing Director (Promoter)
• Background: Not extensively disclosed in public domain
• Tenure: Founded company in 2009 (17 years at helm)
Track Record:
o Scaled company from startup to ₹400+ Cr revenue
o Successfully diversified into green hydrogen (strategic vision)
o Maintained profitability through multiple cycles
o Recent margin compression raises execution questions
Rejal Shalin Sheth - Executive Director
• Background: Operations and project execution
• Likely role: Day-to-day operations, customer relationships
• Family connection: Creates succession/governance considerations
Observable Management Traits:
Strategic Vision (8/10):
• Early recognition of green hydrogen opportunity
• Diversification into renewable energy ahead of policy clarity
• International expansion to 45+ countries shows ambition
• Carbon credit targets (4M → 80M) seem overly aggressive
Execution Capability (6.5/10):
• Operational track record in transmission business (15+ years)
• Successfully set up 120 MW electrolyser facility
• Margin compression despite revenue growth shows execution challenges
• Working capital management (173 days receivables) is poor
• Green hydrogen business unproven at scale
Capital Allocation (7/10):
• Aggressive deleveraging (D/E 0.75 → 0.29)
• Prudent funding mix (preferential issue + internal accruals)
• Strategic investments in high-growth areas (green hydrogen, BESS)
• Multiple MoUs without clear prioritization (capital deployment risk)
• No dividend policy (zero payouts) - appropriate for growth stage
Communication & Transparency (5/10):
• Limited investor relations infrastructure
• Infrequent quarterly concalls or investor presentations
• No detailed segment reporting in financials
• Promoter stake reduction not publicly explained
• Regular regulatory filings and compliance
Corporate Governance Assessment
Key Governance Indicators:
- Board Independence (6/10)
• 4 out of 6 directors are independent (67% - good)
• Limited disclosure on independent director selection criteria
• No disclosed board evaluation process
• Woman director present (regulatory compliance)
- Committee Structure (5/10)
Committees Formed:
• Audit Committee: Formed as per Companies Act requirements
• CSR Committee: Operational and conducting CSR activities
• Nomination & Remuneration Committee: Status not clearly disclosed
• Stakeholder Relationship Committee: Status not disclosed
• No disclosure of committee composition, meeting frequency, or effectiveness
- Audit Quality (4/10)
FY25 Audit Opinion: QUALIFIED
Issue: Delayed correction of material error in Joint Venture's financial statements
Management Explanation: Internal approval process delays at JV partner level
Investor Concern:
• Qualified opinions are red flags for institutional investors
• Indicates either control issues or accounting irregularities
• JV partner (TG China) governance may be weak
• If this persists in FY26, major governance concern
Auditor: Details not disclosed in available materials
- Related Party Transactions (6/10)
• Limited disclosure on RPT framework
• JV structure with TG China disclosed
• TECO 2030 stake acquisition disclosed
• No comprehensive RPT schedule in public documents
• Promoter family involvement in management creates potential conflicts
- Shareholder Rights (6/10)
• Regular AGMs conducted
• Voting rights proportional to shareholding
• Postal ballot/e-voting details not disclosed
• Minority shareholder protection mechanisms not articulated
• No disclosed whistle-blower policy or grievance redressal
- Disclosure Standards (5/10)
• Timely regulatory filings (BSE/NSE)
• Limited voluntary disclosures beyond statutory requirements
• No quarterly investor presentations or detailed business updates
• Limited disclosure on order book composition and customer concentration
• No disclosed risk management framework
Analysis of Annual Shareholder Communications
From FY25 Director's Report:
Key Management Initiatives Disclosed:
- Sustainability & ESG Focus:
"Commitment to pursue innovation and focus on import substitution, aligned with national priorities and global clean energy trends."
• Clear articulation of sustainability mission
• Alignment with government priorities (Atmanirbhar Bharat)
• Entry into carbon markets and green hydrogen ecosystem
- Business Diversification Strategy:
"Forayed into Solar EPC projects, manufacturing of electrolysers and fuel cells assembly, and sustainability consultancy services."
• Transparent communication of new business ventures
• Strategic rationale provided (energy transition theme)
• Limited disclosure on expected economics or timelines
- Vision Statement:
"Advait is not just building infrastructure—we are building the foundation for a cleaner, more resilient, and sustainable energy future for India."
• Inspiring long-term vision
• Stakeholder-centric messaging (beyond just profits)
• Very broad - lacks specific measurable targets
- CSR Commitment:
• CSR committee formed and functional
• CSR expenditure report annexed to annual report
• Specific CSR projects and impact not detailed in available materials
• CSR spend as % of PAT not disclosed
What's Missing in Annual Report:
• Specific financial targets (revenue, margin, ROE goals)
• Order book guidance and pipeline visibility
• Segment-wise strategy and resource allocation
• Management Discussion & Analysis (MD&A) depth insufficient
• Risk factors not comprehensively discussed
• Succession planning for promoter-led management
• Technology roadmap and R&D priorities
• Capital allocation framework (how growth will be funded)
Management Red Flags & Concerns
Critical Issues:
1. Qualified Audit Opinion (High Severity)
• Persistent qualified opinions destroy institutional confidence.
• Must be resolved in FY26 or credibility severely damaged.
• Indicates potential control weaknesses in JV governance.
2. Promoter Stake Dilution Without Explanation (Medium Severity)
• 2.66% dilution over 12 months without public disclosure of rationale
• Creates uncertainty about promoter commitment.
• Recommendation: Management should publicly clarify reasons
3. Aggressive & Unrealistic Targets (Medium Severity)
• Carbon credits: 4M → 80M by FY27 (20x growth in 18 months)
• Appears promotional rather than achievable.
• Damages management credibility if repeatedly missed.
4. Limited Investor Communication (Medium Severity)
• No regular quarterly concalls (unlike peers)
• No investor presentations on website
• Creates information asymmetry favoring insiders.
5. Working Capital Management Failure (High Severity)
• 173 debtor days significantly above industry
• Indicates weak execution on collections.
• Management not addressing this publicly.
Management Quality Score: 6/10 (Adequate with Concerns)
Dimension | Score (1-10) | Key Factors
Strategic Vision | 8 | Strong foresight on green energy transition
Execution Track Record | 6.5 | Mixed - growth strong, margins weak
Capital Allocation | 7 | Prudent deleveraging, smart funding mix
Transparency & Communication | 5 | Limited investor relations, poor disclosure
Governance Standards | 4 | Qualified audit, limited board transparency
Integrity & Ethics | 7 | No scandals, but governance gaps exist
Overall: Management has strong strategic vision and track record of growth, but execution challenges (margins, working capital) and governance weaknesses (qualified audit, limited transparency) are concerning.
For Institutional Investors: Governance gaps likely explain lack of FII/DII participation (0.37% holding).
ESG (Environmental, Social, Governance) Factors
Environmental (E) - STRONG
Score: 8.5/10
Positive Factors:
1. Core Business Aligned with Climate Goals (10/10)
• Green hydrogen manufacturing (zero-emission energy)
• Solar EPC projects (renewable energy deployment)
• Battery Energy Storage Systems (grid decarbonization)
• Power transmission infrastructure (enabling renewable integration)
• Business model is inherently climate-positive
2. Carbon Credit Business (8/10)
• Currently managing 4+ million carbon credits
• Offering carbon neutrality consultancy services.
• Helping clients achieve decarbonization targets.
• Target of 80M credits by FY27 appears aggressive.
3. Sustainable Product Portfolio (9/10)
• Electrolysers enable green hydrogen production (replacing grey hydrogen)
• OPGW reduces land footprint for telecom/power infrastructure
• Live-line installation reduces power outages (energy efficiency)
• Estimated avoided emissions: Electrolysers could enable 50,000-100,000 tons CO2 reduction annually
4. Environmental Certifications (6/10)
• ISO 14001 (Environmental Management) status not disclosed
• Green building certification for facilities not mentioned
• Limited disclosure on environmental compliance track record
• Needs improvement: Obtain and disclose international environmental certifications
5. Resource Efficiency (6/10)
• Energy consumption per unit of production not disclosed
• Water usage and wastewater management not discussed
• Waste recycling and circular economy initiatives not mentioned
• Manufacturing in Gujarat (solar-rich state) - potential for captive renewable energy
Areas for Improvement:
• Publish annual Sustainability Report with quantified environmental metrics
• Set science-based emission reduction targets (SBTi framework)
• Disclose Scope 1, 2, 3 emissions and reduction roadmap
• Obtain ISO 14001 and ISO 50001 certifications
Social (S) - MODERATE
Score: 6/10
Positive Factors:
1. CSR Activities (6/10)
• CSR Committee formed and operational
• CSR expenditure incurred as per Companies Act (2% of average net profits)
• Specific CSR projects not disclosed in available materials
• CSR impact assessment not published
• Focus areas likely education, healthcare, rural development (not confirmed)
2. Job Creation & Skills Development (7/10)
• Manufacturing facilities in Gujarat creating skilled technical jobs
• Green hydrogen sector requires specialized training
• Estimated employment: 300-500 direct employees, 1,000+ indirect
• Employee headcount growth not disclosed
• Training hours per employee not reported
• Gender diversity in workforce not disclosed
3. Occupational Health & Safety (7/10)
• Live-line installation requires stringent safety protocols
• High-voltage work necessitates safety certifications
• ISO 45001 certification status not disclosed
• Lost Time Injury Frequency Rate (LTIFR) not reported
• Safety training hours not quantified
4. Community Impact (6/10)
• Projects across 45+ countries improving energy access
• Rural electrification enabling socio-economic development
• Community engagement programs not disclosed
• Local sourcing/procurement policies not mentioned
• Social impact assessment not published
5. Labor Practices & Human Rights (5/10)
• Employee benefits and compensation policies not disclosed
• Labor union relationships not mentioned
• Supply chain labor standards not discussed
• Anti-discrimination and equal opportunity policies not published
• Major Gap: No disclosed human rights policy or due diligence framework
6. Customer Welfare (7/10)
• Power transmission reliability improves electricity access
• Green hydrogen enables cleaner industrial processes
• No reported product safety or quality issues
• Customer satisfaction metrics not disclosed
Areas for Improvement:
• Publish detailed CSR report with project descriptions and impact metrics
• Disclose workforce diversity statistics
• Obtain ISO 45001 occupational health & safety certification
• Develop and publish Human Rights Policy aligned with UN Guiding Principles
• Report employee engagement scores and attrition rates
• Implement supply chain labor audits for critical suppliers
Governance (G) - WEAK
Score: 5/10
Positive Factors:
1. Board Structure (6/10)
• 67% independent directors (4 out of 6)
• Woman director present
• Audit and CSR committees formed
• Committee effectiveness not demonstrated
2. Regulatory Compliance (7/10)
• Timely statutory filings (BSE/NSE)
• No SEBI/regulatory penalties reported
• Companies Act compliance maintained
• Listing obligations met
3. Promoter Stake & Commitment (6/10)
• Promoters hold 66.80%
• No share pledging
• Declining stake without explanation
• No disclosed promoter code of conduct
Negative Factors:
1. Audit Quality - MAJOR RED FLAG (3/10)
• Qualified audit opinion on FY25 consolidated statements
• Material error in JV accounting not timely corrected
• Raises questions about internal controls and JV oversight
• Must be resolved in FY26
2. Disclosure Standards (4/10)
• No quarterly investor presentations
• Limited MD&A
• Segment reporting minimal
• Order book composition not detailed
• Customer concentration risk not disclosed
• Technology partnership financial terms not disclosed
3. Related Party Transactions (5/10)
• JV with TG China
• TECO 2030 stake acquisition terms not fully disclosed
• Promoter family in management
• No comprehensive RPT policy published
4. Risk Management (4/10)
• No disclosed ERM framework
• Risk committee status not disclosed
• Key risk factors inadequately discussed
• Business continuity planning not mentioned
5. Anti-Corruption & Ethics (5/10)
• No published Code of Conduct
• Anti-bribery and anti-corruption policies not disclosed
• No whistle-blower mechanism publicly disclosed
• Ethics hotline not mentioned
• No reported corruption scandals
6. Investor Relations (3/10)
• Minimal IR infrastructure
• No quarterly earnings concalls
• No investor days or roadshows
• Promoter stake reduction unexplained
• Result: 0.37% institutional holding
7. Succession Planning (4/10)
• No disclosed succession plan
• Heavy dependence on Managing Director
• Key man risk not addressed
• Management depth below board level not disclosed
Areas for Improvement (Critical):
- Resolve qualified audit opinion
- Establish robust investor relations with quarterly concalls
- Publish comprehensive Corporate Governance Report
- Develop and disclose ERM framework
- Implement whistle-blower policy
- Enhance board disclosures
- Succession planning for key roles
- Publish Related Party Transaction policy
Overall ESG Score: 6.7/10 (Moderate)
Pillar | Score | Weight | Weighted Score | Assessment
Environmental (E) | 8.5 | 40% | 3.4 | Strong - core business climate-positive
Social (S) | 6.0 | 30% | 1.8 | Moderate - basic compliance, limited disclosure
Governance (G) | 5.0 | 30% | 1.5 | Weak - qualified audit, poor investor relations
TOTAL | - | 100% | 6.7 | Moderate, with governance drag
ESG Strengths vs. Weaknesses
Strengths:
• Business model inherently sustainable (green hydrogen, renewables)
• Strong alignment with UN SDGs (Goal 7: Affordable Clean Energy, Goal 13: Climate Action)
• Enabling India's energy transition and decarbonization
• No environmental controversies or social conflicts
Weaknesses:
• Governance practices below institutional standards
• Qualified audit opinion is disqualifying for many ESG funds
• Minimal ESG reporting and transparency
• No ESG framework (GRI, SASB, TCFD) adoption
For ESG-Focused Investors:
• "E" credentials are strong - suitable for climate/clean energy funds
• "S" is basic - acceptable but not differentiated
• "G" is weak - likely excludes Advait from ESG indices and funds
To Qualify for ESG Funds:
- Resolve qualified audit (non-negotiable)
- Publish annual Sustainability Report (GRI Standards)
- Obtain ESG ratings (MSCI, Sustainalytics, CDP)
- Set net-zero targets and disclose climate risks (TCFD framework)
- Enhance board independence and diversity
- Implement robust grievance redressal and whistle-blower policies
Risk Analysis - Comprehensive Framework
Overall Risk Rating: 6.5/10 (Medium-High)
Market Risks - MODERATE TO HIGH
Risk Rating: 6/10
1. Commodity Price Volatility (HIGH IMPACT)
• Affected inputs: Aluminum, steel, copper (30-50% of COGS)
• Current environment: Elevated prices
• Evidence: Q3 FY26 margin compression (-405 bps) partially attributable
• Mitigation: Limited hedging capacity; pass-through clauses in contracts (partial)
• Severity: 7/10
2. Currency Fluctuation Risk (MEDIUM IMPACT)
• Exposure: 25-30% revenue from international operations
• Risk: INR depreciation increases import costs (battery cells, electrolyser components)
• Opportunity: INR depreciation improves export competitiveness
• Natural hedge: Imports + exports provide partial offset
• Mitigation: Limited disclosure of hedging strategies
• Severity: 5/10
3. Interest Rate Risk (LOW IMPACT)
• Direct exposure: Low (0.29x D/E, 17.4x interest coverage)
• Indirect exposure: Customer financing costs affect project economics
• Current trend: RBI easing cycle expected (favorable)
• Severity: 3/10
4. Stock Market Volatility (HIGH IMPACT for short-term investors)
• Liquidity: Low (₹15-20 Cr daily volume)
• Float: Retail-dominated (32.83%)
• Behavior: High beta, 10%+ single-day swings
• Severity: 8/10 for traders, 4/10 for long-term investors
Operational Risks - HIGH
Risk Rating: 7/10
1. Margin Compression Risk (CRITICAL - ONGOING)
• Evidence: Operating margin 15.5% → 11.45% (Q3 FY25 to Q3 FY26)
• Causes: Commodity inflation, scale-up costs, competitive pressure
• Probability: High (60%) that margins stay compressed in near term
• Impact: High - profitability and valuation directly affected
• Mitigation: Sequential QoQ improvement (6.48% → 8.24% net margin) suggests stabilization
• Monitoring: Q4 FY26 and Q1 FY27 margins critical
• Severity: 9/10
2. Project Execution Delays (MEDIUM)
• Risk: Land acquisition, approvals, grid connectivity delays
• Affected segments: Solar EPC, BESS BOO projects
• Industry context: 30-40% of solar projects face 6+ month delays
• Company exposure: EPC model transfers most risk to customers
• Severity: 6/10
3. Technology Obsolescence (MEDIUM-HIGH)
• Risk: AEM electrolysers or breakthrough tech makes current PEM/alkaline less competitive
• Timeline: 3-5 years for commercial AEM scale-up
• Company hedges: Partnerships for AEM (CENmat), multi-technology portfolio
• Capex at risk: ₹100-150 Cr in electrolyser manufacturing
• Severity: 6.5/10
4. Working Capital Strain (HIGH - ONGOING)
• Evidence: 173 debtor days vs. 120-150 industry norm
• Impact: Cash flow pressure despite paper profits
• Risk: May require dilutive equity raise if worsens
• Mitigation: Strong balance sheet (net cash) provides cushion
• Severity: 7/10
5. Key Man Risk (MEDIUM)
• Dependency: Heavy reliance on promoter MD Shalin Sheth
• Succession: No disclosed plan
• Depth: Management team below board not disclosed
• Severity: 6/10
6. Quality Control & Safety (MEDIUM)
• Nature of work: High-voltage live-line installation (inherently risky)
• Track record: 10,000+ km without major reported incidents (positive)
• Risk: Major safety incident could halt operations and damage reputation
• Severity: 6/10
Regulatory & Policy Risks
Risk Rating: 7.5/10
Green Hydrogen Policy Execution Risk (CRITICAL)
• Dependency: 40-50% of growth strategy tied to Green Hydrogen Mission
• Risk scenarios:
o Subsidy delays or reduction
o 5 MMT target scaled back to 2-3 MMT
o Blending mandates delayed
o PLI scheme changes adversely
• Probability: Medium (30-40%)
• Impact: Very High - could derail growth narrative
• Mitigation: Diversified business (transmission still 70% of revenue)
• Severity: 8.5/10
Government Capex Dependency (HIGH)
• Exposure: 70-80% of transmission revenue from government utilities
• Risks:
o Fiscal tightening reducing capex
o Election cycle delays
o Project approval slowdowns
• Current environment: Favorable (Budget 2026 supportive)
• Probability: Medium (25-30% of slowdown)
• Impact: High (direct revenue impact)
• Severity: 7/10
Discom Payment Delays (HIGH - ONGOING)
• Evidence: 173 debtor days indicates payment collection challenges
• Industry context: Discom losses ₹50,000+ Cr annually
• Risk: Payment delays extend to 250-300 days
• Impact: Working capital crisis, potential provisioning
• Severity: 8/10
Import / Export Policy Changes (MEDIUM)
• Risk: Tariff changes on critical imports (battery cells, PGM)
• Opportunity: Higher import duties protect domestic electrolyser manufacturing
• China JV risk: Restrictions on Chinese partnerships
• Severity: 5.5/10
Environmental Compliance (LOW)
• Risk: Tightening environmental regulations
• Impact: Core business is green (low exposure)
• Opportunity: Stricter emission norms increase green hydrogen demand
• Severity: 3/10
Financial Risks
Risk Rating: 5/10
Equity Dilution Risk (MEDIUM)
• Triggers: Working capital needs, growth capex, or acquisitions
• Recent action: ₹91.16 Cr preferential issue in FY26
• Promoter stake: Declining (69.46% → 66.80%)
• Risk: Further dilution at high valuations destroys shareholder value
• Mitigant: Strong balance sheet (net cash) delays need
• Severity: 6/10
Receivables Default Risk (MEDIUM)
• Exposure: 173 days receivables, mostly government entities
• Risk: Discom financial distress leading to write-offs
• Probability: Low-Medium (15-20%)
• Impact: Medium (potential 2-3% provisioning)
• Severity: 5/10
Debt Servicing Risk (VERY LOW)
• Current leverage: 0.29x D/E
• Interest coverage: 17.4x
• Net position: Cash > Debt
• Assessment: Minimal risk
• Severity: 2/10
Foreign Exchange Risk (LOW-MEDIUM)
• Natural hedge: 25% international revenue offsets import costs
• Unhedged exposure: Not disclosed (likely exists)
• Severity: 4/10
Strategic Risks
Risk Rating: 7/10
Competition from Large Players (CRITICAL)
• Threat: Reliance (5 GW electrolyser), L&T (1.5 GW) entering green hydrogen
• Advantage ratios: 25x and 7.5x capacity vs. Advait's 200 MW
• Risk: Price wars, margin compression, market share loss
• Probability: High (70%)
• Impact: High - could cap Advait to 5-10% market share in niche
• Mitigation: Niche strategy (distributed H2, not gigawatt-scale)
• Severity: 8/10
Technology Partnership Dependency (MEDIUM-HIGH)
• Risk: TECO 2030 financial distress (fuel cells), TG China relationship (OPGW)
• Evidence: TECO 2030 is a Norwegian startup (financial stability uncertain)
• Impact: Technology access cut-off, licensing fee increases
• Mitigation: Multiple partnerships diversify risk
• Severity: 6.5/10
Execution Bandwidth Constraints (MEDIUM-HIGH)
• Risk: Scaling multiple new businesses simultaneously (green H2, BESS, solar EPC)
• Evidence: Margin compression suggests execution challenges
• Management depth: Not disclosed
• Impact: Projects delayed, quality compromised, cost overruns
• Severity: 7/10
Market Timing Risk - Green Hydrogen (MEDIUM)
• Risk: Company builds capacity ahead of demand (electrolyser overcapacity)
• Industry context: Multiple players ramping capacity for 2030 demand
• Scenario: Demand delayed 3-5 years → stranded assets
• Probability: Medium (30%)
• Severity: 6.5/10
Customer Concentration (MEDIUM)
• Risk: Dependence on few large customers (e.g., PGVCL ₹216 Cr order)
• Disclosure: Customer concentration not reported
• Impact: Loss of major customer significantly affects revenue
• Severity: 6/10
Geopolitical Risks
Risk Rating: 5.5/10
India-China Tensions (HIGH IMPACT)
• Exposure: JV with TG China for OPGW manufacturing
• Risk: Regulatory restrictions, JV unwinding, supply disruption
• Affected revenue: ~10-15% (OPGW segment)
• Probability: Medium (20-30% over 3 years)
• Severity: 7/10
Global Supply Chain Disruptions (MEDIUM)
• Exposure: Battery cells (China/Korea), PGM (South Africa), semiconductors (Taiwan)
• Recent precedent: COVID-19, Russia-Ukraine war
• Mitigation: Limited - working capital constraints limit inventory buffering
• Severity: 6/10
Middle East / Global Energy Crisis (LOW-MEDIUM)
• Impact: Aluminum/steel prices (energy-intensive production)
• Opportunity: Accelerates green hydrogen adoption
• Net assessment: Neutral to positive
• Severity: 4/10
ESG & Reputational Risks
Risk Rating: 6/10
Qualified Audit Opinion (HIGH REPUTATIONAL RISK)
• Current status: FY25 consolidated statements qualified
• Impact: Institutional investors avoid stock
• Persistence: If continues in FY26, severe credibility damage
• Severity: 8/10
Safety Incident Risk (MEDIUM)
• Nature: High-voltage live-line work inherently dangerous
• Track record: No major reported incidents
• Impact if occurs: Project halts, litigation, reputation damage
• Severity: 6/10
Labor Practices / Social Conflicts (LOW)
• Risk: Labor disputes, community opposition to projects
• Probability: Low (no history)
• Severity: 4/10
Environmental Incident (LOW)
• Risk: Pollution, waste mismanagement at manufacturing facilities
• Business nature: Low environmental footprint (assembly, not heavy industry)
• Severity: 3/10
Cybersecurity & Data Risks - LOW
Risk Rating: 4/10
• Exposure: IoT devices in BESS, SCADA systems, customer data
• Disclosure: No disclosed cybersecurity framework
• Industry: Increasing attacks on energy infrastructure
• Mitigation: Likely basic but not disclosed
• Severity: 5/10 (could increase as digitalization grows)
Consolidated Risk Matrix
Risk Category | Rating (1-10) | Weight | Weighted Score | Top 3 Specific Risks
Market Risks | 6.0 | 10% | 0.60 | Commodity prices, stock volatility
Operational Risks | 7.0 | 25% | 1.75 | Margin compression, working capital, execution
Regulatory/Policy Risks | 7.5 | 20% | 1.50 | Green H2 policy, discom payments, govt capex
Financial Risks | 5.0 | 15% | 0.75 | Equity dilution, receivables default
Strategic Risks | 7.0 | 20% | 1.40 | Large player competition, partnership dependency
Geopolitical Risks | 5.5 | 5% | 0.28 | China tensions, supply chain disruptions
ESG/Reputational Risks | 6.0 | 5% | 0.30 | Qualified audit, safety incidents
TOTAL | - | 100% | 6.6/10 | MEDIUM-HIGH OVERALL RISK
Top 10 Risks Ranked by Severity
- Margin Compression (9/10) - Ongoing, threatens profitability
- Green Hydrogen Policy Execution (8.5/10) - Core to growth thesis
- Competition from Reliance/L&T (8/10) - Existential long-term threat
- Discom Payment Delays (8/10) - Evidenced by 173 debtor days
- Qualified Audit Opinion (8/10) - Blocks institutional investment
- Government Capex Dependency (7/10) - Revenue concentration risk
- Working Capital Strain (7/10) - Cash flow pressure
- Execution Bandwidth (7/10) - Scaling multiple businesses simultaneously
- China JV Dependency (7/10) - OPGW segment vulnerability
- Technology Obsolescence (6.5/10) - AEM electrolysers could disrupt
Risk Management - Company's Approach
Disclosed Risk Mitigation Strategies:
- Diversification: Transmission (mature) + Green Energy (growth) portfolio
- Technology Hedges: Multiple electrolyser types (alkaline, PEM, AEM partnerships)
- Geographic Diversification: 45+ countries (though India still 70%)
- BOO Model for BESS: Retains deployment flexibility, creates annuity revenue
- Strong Balance Sheet: Net cash position provides cushion
What's Missing:
• No disclosed Enterprise Risk Management (ERM) framework
• No commodity hedging program
• No disclosed business continuity/disaster recovery plans
• Limited disclosure on insurance coverage
• No scenario planning or stress testing published
Risk Management Score: 5/10 (Basic, Reactive vs. Proactive)
Risk Recommendations for Management
Immediate (Next 2 Quarters):
- Resolve qualified audit opinion (non-negotiable)
- Implement commodity hedging for aluminum/steel (50% of exposure)
- Working capital task force - reduce receivables to <150 days
- Margin recovery plan - communicate specific initiatives publicly
Medium-Term (6-12 months):
- Develop ERM framework with board-level risk committee
- Secure long-term battery supply agreements (2-3 year contracts)
- Diversify away from China JV - develop alternative OPGW sourcing
- Enhance investor relations - quarterly concalls, detailed disclosures
Long-Term (1-2 years):
- Build management depth - hire professional CXOs outside promoter family
- Succession planning for key positions
- ESG framework implementation - GRI reporting, TCFD disclosures
- Geographic revenue diversification - increase international to 40%+
Risk Assessment for Investors
Risk Tolerance Required: HIGH
Suitable For:
• Investors with 5+ year horizon
• High risk tolerance (comfortable with 40-50% volatility)
• Portfolio allocation <3% (speculative bucket)
• Conviction in India's energy transition story
NOT Suitable For:
• Conservative investors seeking stable income
• Short-term traders (liquidity risk, volatility)
• Investors requiring dividend income
• Large institutional mandates (liquidity, governance concerns)
Risk-Adjusted Return Expectation:
• Best Case (20% probability): 15-25% CAGR (if execution flawless)
• Base Case (50% probability): 8-12% CAGR (moderate growth, margin recovery)
• Bear Case (30% probability): -10% to +5% (margins stay compressed, competition intensifies)
Expected Value: ~8% CAGR (weighted probability)
Comparison: Nifty 50 expected return ~12-14% CAGR with lower risk
Verdict: Risk-reward ratio currently unfavorable at ₹1,745. Better opportunities exist unless price corrects 20-30% or margins recover convincingly.
FINAL INVESTMENT RECOMMENDATION SUMMARY
Overall Investment Grade: C+ (Speculative Growth with High Risk)
Quick Summary Scorecard
Dimension | Score (1-10) | Weight | Weighted | Key Takeaway
Business Quality | 7.0 | 15% | 1.05 | Strong growth, diversified portfolio, niche positioning
Financial Health | 7.4 | 20% | 1.48 | Excellent balance sheet, but margin compression concerning
Competitive Position | 6.0 | 15% | 0.90 | Moderate moats, facing large player competition
Management Quality | 6.0 | 15% | 0.90 | Good vision, execution mixed, governance weak
Growth Prospects | 8.0 | 10% | 0.80 | High-growth segments, but policy-dependent
Valuation | 3.5 | 15% | 0.53 | Expensive (25-40% overvalued), no margin of safety
Risk Profile | 3.5 | 10% | 0.35 | High operational, regulatory, and strategic risks
TOTAL SCORE | - | 100% | 6.0/10 | HOLD / WAIT (Conditional Opportunity)
Investment Thesis - Bull vs. Bear
BULL CASE (25-30% Probability)
STRATEGIC PPOINSIGHT
If you believe:
• India's Green Hydrogen Mission executes on schedule (5 MMT by 2030)
• Advait captures 10-15% of distributed electrolyser market
• Operating margins recover to 14-16% by FY27
• Working capital improves to industry norms (<150 days)
• Institutional investors validate thesis (5%+ FII/DII stake)
• Management resolves qualified audit and improves governance
Potential Returns:
The Critical Pivot Point: The "Bull Case" requires Advait to transition from being a fast-follower in manufacturing to an execution leader in specialized niches.
• Fair Value: ₹2,200-2,500 by FY28
• Return: 25-40% upside from ₹1,745
• CAGR: 15-20% over 3 years
BEAR CASE (30-35% Probability)
If you believe:
• Green hydrogen demand delayed 3-5 years due to policy/economics
• Reliance/L&T price wars crush margins further (to 8-10% EBITDA)
• Working capital deteriorates, forcing dilutive equity raise
• Qualified audit persists, blocking institutional participation
• Promoter stake drops below 60%, signaling lack of confidence
• Order book growth stalls as MoUs fail to convert
Potential Losses:
• Fair Value: ₹900-1,100 by FY27
• Downside: -40% to -50% from ₹1,745
• CAGR: -15% to -20% over 3 years
BASE CASE (40-45% Probability)
CRITICAL FACTOR
Most Likely Scenario:
• Green hydrogen scales slower than hoped (2-3 MMT by 2030)
• Advait maintains 5-8% electrolyser market share in niche
• Margins stabilize at 12-13% (below target, above current)
• Working capital improves modestly to 150-160 days
• Limited institutional participation (2-3% FII/DII)
• Transmission business provides steady cash flow
Expected Returns:
The Risk/Reward Skew: At a current price of ₹1,745, the risk-reward ratio is asymmetric to the downside. The stock offers roughly 25–40% upside in a flawless bull scenario but faces a potential 40–50% drawdown if the bear case materializes.
• Fair Value: ₹1,300-1,500 by FY27
• Return: -8% to -25% from ₹1,745 (correction first, then recovery)
• CAGR: 5-8% over 3 years
Price-Based Recommendations
Current Price | Valuation | Action | Position Size | Rationale
Below ₹1,000 | Very Attractive | STRONG BUY | Up to 5% | Significant margin of safety, asymmetric upside
₹1,000-1,200 | Attractive | BUY | 3-4% | Fair value with some safety margin
₹1,200-1,400 | Fair Value | ACCUMULATE | 2-3% | Base case justified, balanced risk-reward
₹1,400-1,600 | Slight Premium | HOLD / SMALL BUY | 1-2% | Requires moderate bull case, small speculative bet OK
₹1,600-1,800 | Expensive | HOLD (Existing) / AVOID (New) | 0-1% | Limited upside, high execution risk
₹1,745 (Current) | 25-40% Overvalued | WAIT / BOOK PROFITS | Reduce to <2% | No margin of safety, asymmetric downside risk
Above ₹1,900 | Very Expensive | SELL / SHORT | 0% | Euphoric pricing, high probability of correction
Feature | Bull Case (Optimistic) | Bear Case (Pessimistic)
Growth Narrative | Hydrogen Leader: Successfully captures 10–15% of the distributed green hydrogen market in India. | Demand Delay: Green Hydrogen Mission adoption slows due to high costs or policy implementation delays.
Financials | Margin Recovery: Operating margins expand back to 14–16% as capacity utilization improves. | Margin Trap: High commodity costs and price wars with giants (Reliance/L&T) keep margins suppressed below 11%.
Governance | Clean Slate: Resolves the qualified audit opinion and improves transparency, attracting institutional investors. | Governance Gap: Audit qualifications persist, and promoter stake continues to decline without clear explanation.
Operations | Efficiency Gain: Receivables days drop below 150; working capital cycle normalizes. | Capital Crunch: Receivables stretch toward 200 days, forcing a dilutive equity raise to fund operations.
Market Impact | Re-rating: FII/DII holding climbs to 5–8%, leading to a valuation re-rating toward 60x PE. | Retail Sell-off: Lack of institutional support leads to sharp volatility and a 40–50% price correction.
Specific Recommendations by Investor Type
- Conservative Investors (Low Risk Tolerance)
• Action: AVOID at current price
• Rationale: High volatility, no dividends, execution risk, governance concerns
• Alternative: Wait for <₹1,200 or invest in large-cap electrical equipment companies - Growth Investors (Moderate-High Risk Tolerance)
• Action: WAIT for ₹1,200-1,400 OR Hold small position (1-2%)
• Rationale: Good growth story but expensive valuation limits upside
• Strategy: Buy on 20-30% correction; Set stop-loss at ₹1,500 - Thematic/ESG Investors (Green Energy Focus)
• Action: SMALL POSITION (<2%) as thematic bet
• Rationale: Strong "E" credentials (green hydrogen, renewables) offset governance concerns
• Caution: Qualified audit makes it unsuitable for strict ESG mandates - Value Investors
• Action: AVOID at ₹1,745 - wait for <₹1,200
• Rationale: No margin of safety; expensive on all metrics (P/E, EV/EBITDA, P/B)
• Entry Target: 25-30% correction to create value opportunity - Momentum/Technical Traders
• Action: TRADE range-bound (buy ₹1,650-1,700, sell ₹1,850-1,900)
• Rationale: High volatility creates trading opportunities
• Caution: Low liquidity, tight stop-losses essential - Existing Shareholders
• Action: BOOK PARTIAL PROFITS or HOLD with stop-loss at ₹1,500
• Strategy:
o If bought <₹1,200: Book 50% profits, hold balance
o If bought ₹1,200-1,500: Hold with trailing stop-loss
o If bought >₹1,600: Book losses or wait for bounce to exit
Critical Monitoring Points (Quarterly Review Required)
Must Monitor - Deal-Breakers:
- Q4 FY26 Operating Margins: Must show improvement toward 13%+; further compression is RED FLAG
- FY26 Audit Opinion: Qualified opinion repeating is SELL signal
- Promoter Holding: Dropping below 65% without explanation warrants exit
- Green Hydrogen Orders: Need ₹150-200 Cr+ orders by Q2 FY27 to validate thesis
- Working Capital: Receivables days should trend toward 150; worsening to 190+ is concern
Watch - Warning Signals:
6. Institutional Holding: No improvement (stays <1%) indicates market rejection
7. Order Book Growth: <50% YoY growth suggests demand slowing
8. Margin Guidance: Management inability to provide margin recovery roadmap
9. Competitor Actions: Reliance/L&T aggressive pricing announcements
10. Policy Delays: Green Hydrogen Mission implementation slowdowns
Positive Catalysts:
11. Large Order Wins: ₹300-500 Cr electrolyser orders from major industrial players
12. Institutional Entry: Mutual fund takes 5%+ stake (validates thesis)
13. Margin Beat: Operating margin exceeds 14% for 2 consecutive quarters
14. Strategic Partnership: JV with global electrolyser leader or technology breakthrough
15. Index Inclusion: Addition to BSE SmallCap index
Exit Triggers - When to Sell
Immediate Exit (SELL within 1-2 weeks):
• FY26 audit qualified again (governance failure)
• Promoter stake drops below 60% suddenly (loss of confidence)
• Major customer (PGVCL-level) cancels order
• Operating margin falls below 10% for 2 consecutive quarters
• Debt-to-Equity rises above 0.5x (balance sheet deterioration)
Gradual Exit (Reduce over 1-3 months):
• Green hydrogen order book not growing (flat QoQ for 2-3 quarters)
• Receivables days exceed 200 (working capital crisis)
• Major competitor (Reliance) announces aggressive pricing 30-40% below Advait
• Stock breaks below ₹1,500 on high volume (technical breakdown)
Profit Booking (If targets met):
• Stock reaches ₹2,200+ (base case fair value achieved)
• Position grows to >5% of portfolio due to appreciation (rebalance)
• Better risk-reward opportunities emerge elsewhere
Position Sizing Recommendation
Maximum Allocation:
• Aggressive Growth Portfolio: 3-5%
• Balanced Portfolio: 2-3%
• Conservative Portfolio: 0% (not suitable)
At Current Price (₹1,745):
• New Investors: 0-1% (wait for better entry)
• Existing Investors: Hold or reduce to 2%
Investment Summary
THIS IS A "SHOW ME" STORY. INVESTORS SHOULD LOOK FOR TWO CONSECUTIVE QUARTERS OF MARGIN IMPROVEMENT AND INSTITUTIONAL ENTRY AS THE PRIMARY GREEN LIGHTS FOR A LONG-TERM POSITION.
Final Verdict
Investment Rating: HOLD / WAIT
Summary:
Advait Energy Transitions is a genuine high-growth story positioned in attractive secular trends (green hydrogen, renewable energy, power infrastructure). The company has delivered exceptional revenue growth (91% FY25, 114% Q3 FY26), maintains a fortress balance sheet (net cash, 0.29x D/E), and demonstrates strong return ratios (42.4% ROE).
However, the stock at ₹1,745 is 25-40% overvalued based on current fundamentals. Critical concerns include:
• Margin compression (15.5% → 11.45% operating margin)
• Poor working capital management (173 debtor days)
• Qualified audit opinion (governance red flag)
• Zero institutional validation (0.37% FII+DII)
• Intense competition from Reliance/L&T
• Policy execution risk (green hydrogen market development)
The risk-reward ratio is asymmetric to the downside at current prices. The stock offers limited upside (10-15% to fair value) but significant downside risk (40-50% in bear case).
Who Should Invest?
YES - Consider Investing IF:
• You wait for correction to ₹1,200-1,400 levels
• You have very high risk tolerance and 5+ year horizon
• You allocate <3% of portfolio (speculative bucket)
• You have strong conviction in India's green hydrogen opportunity
• You can monitor quarterly and exit if triggers hit
NO - Avoid IF:
• You need stable income or low volatility
• You're a conservative investor
• You require institutional validation before investing
• You can't tolerate 40-50% drawdowns
• Current price is your only entry opportunity (WAIT)
Three-Year Price Targets
Scenario | Probability | FY28 Price Target | 3-Year CAGR from ₹1,745
Bear Case | 30% | ₹900-1,100 | -15% to -20%
Base Case | 45% | ₹1,300-1,500 | -5% to -8%
Bull Case | 25% | ₹2,200-2,500 | +8% to +13%
Expected Value (Probability-Weighted) | 100% | ₹1,420 | -6% CAGR
CONCLUSION
Advait Energy Transitions presents a compelling growth narrative in India's energy transition but suffers from execution challenges, governance weaknesses, and excessive valuation. At ₹1,745, the stock prices in an aggressive bull case with minimal margin for error.
For most investors: WAIT for:
- Price correction to ₹1,200-1,400 (20-30% downside), OR
- Margin recovery confirmation (2-3 consecutive quarters at 13%+ operating margin), OR
- Institutional validation (FII/DII stake reaching 5%+)
Only for high-risk thematic investors: Small position (1-2%) acceptable as speculative bet on green hydrogen theme, with strict stop-loss at ₹1,500 and quarterly monitoring of critical metrics.
The company has potential to be a multi-bagger IF green hydrogen scales as planned and management executes flawlessly. However, current valuation leaves no room for disappointment, and multiple execution risks make this a "show me" story rather than a "buy and hold" opportunity at present prices.
Best Strategy: Add to watchlist, monitor quarterly execution, and pounce on 25-30% correction or wait for fundamental inflection (margin recovery + institutional entry).

Next Review Due: Post Q4 FY26 Results (May 2026)
Disclaimer: This analysis is for educational and informational purposes only and does not constitute investment advice. Investors should conduct independent due diligence and consult qualified financial advisors before making investment decisions. Past performance does not guarantee future results. Small-cap stocks carry significantly higher risks than large-cap stocks, including liquidity risk, volatility, and business failure risk.
COMPLIANCE & DISCLAIMER
www.oorjita.ai is not operated by a broker, a dealer, or a registered investment adviser. Under no circumstances does any information posted on www.oorjita.ai represent a recommendation to buy or sell a security. The information on this site, and in its related newsletters, is not intended to be, nor does it constitute investment advice or recommendations. The information on this site is in no way guaranteed for completeness, accuracy or in any other way. In no event shall Oorjita Fin AI Services be liable to any member, guest or third party for any damages of any kind arising out of the use of any content or other material published or available on www.oorjita.ai, or relating to the use of, or inability to use, www.oorjita.ai or any content, including, without limitation, any investment losses, lost profits, lost opportunity, special, incidental, indirect, consequential or punitive damages. Past performance is a poor indicator of future performance.
Oorjita FinAI Services | www.oorjita.ai | insights@oorjita.ai
Subscribe to unlock premium content
Independent research, deep company analysis, and quarterly insights -
designed to help you think clearly, not trade noisily.
DHARMAJ CROP GUARD LIMITED

NATCO PHARMA LIMITED

10 Productivity tools that are worth checking out

DHARMAJ CROP GUARD LIMITED
NATCO PHARMA LIMITED
DHARMAJ CROP GUARD LIMITED