
March 8th–14th, 2026 – Week Wrap | Nifty Sees Worst Week of 2026 as FII Selling Accelerates ₹35,052 Cr, VIX Spikes 14%, and Breadth Collapse Signals Capitulation


Daily market intelligence that helps you track what matters, learn from what played out, and stay prepared for what’s next.

Popular articles


Nifty 50: 23,151.10 (−5.31% WoW) | FII Net: −₹35,052 Cr | VIX: 22.65 (+14% WoW) | 52W Lows: 509 stocks
THE 90-SECOND SUMMARY
THIS WEEK IN ONE LINE: Nifty crashed 5.31% - worst week of 2026 - as FII sold ₹35,052 Cr with Friday alone contributing ₹10,717 Cr.
THREE NUMBERS THAT MATTER:
- A/D 0.11 (Friday) — 248 advances vs 2,175 declines. 509 new 52-week lows. Near-total capitulation.
- −₹10,717 Cr FII net (Friday) - single-day intensity 63% above the 4-day average. Selling is accelerating, not stabilizing.
- VIX ratcheted to 22.65 - floor rising each week: 14 → 17 → 20 → 22. Persistent fear, not episodic shock. RSI below 30 — oversold.
TRADE IMPLICATION: Max pain at 23,500 with Nifty at 23,151. DII pace (₹37,740 Cr/week) is unsustainable. Bank Nifty 53,500 is the defensive line.
MONDAY WATCH: Nifty 23,000. Breach on volume = 22,500 next. Hold + reversal candle = trade toward 23,500 (max pain).
3 — MARKET DATA DEEP DIVE
3A — Nifty 50 Daily OHLC (Extracted)
Day | Open | High | Low | Close | Chg% | Pattern
Mon 09 | 23,868 | 24,078 | 23,698 | 24,028 | −1.73% | Gap-down, partial recovery
Tue 10 | 24,281 | 24,304 | 24,080 | 24,262 | +0.97% | Dead-cat bounce (only green)
Wed 11 | 24,232 | 24,299 | 23,834 | 23,867 | −1.63% | Bearish engulfing
Thu 12 | 23,675 | 23,833 | 23,556 | 23,639 | −0.95% | Grinding lower
Fri 13 | 23,463 | 23,492 | 23,112 | 23,151 | −2.06% | Capitulation close near low
Source: NSE MW-All-Indices | Confidence: HIGH | WoW: 24,450 → 23,151 = −5.31% [ANOMALY — |WoW| > 5%]
Week Range: 23,112–24,304 | True Range: 1,192 pts | 25-Week MA (est): ~23,800 — Nifty below since Wed
Next-week ATR estimates (1.3 × TR): Nifty 21,602–24,700 | Bank Nifty 49,310–58,206 [MEDIUM confidence]

Bank Nifty & VIX
Index | Mon Close | Tue | Wed | Thu | Fri Close | WoW
Bank Nifty | 56,020 | 56,951 | 55,736 | 55,101 | 53,758 | −3.46%
India VIX | 23.36 | 18.91 | 21.06 | 21.52 | 22.65 | +14% WoW
VIX intraday Monday: 19.22 → 24.49 = 27% range in one session [ANOMALY]. VIX floor ratcheted: 14 → 17 → 20 → 22 over 4 weeks.

Breadth & 52-Week Extremes
Day | Advances | Declines | A/D | Del% | 52W Hi | 52W Lo | Flag
Mon 09 | 340 | 2,076 | 0.16 | 56.8% | 15 | 786 | BROAD DECLINE
Tue 10 | 2,026 | 387 | 5.24 | 55.5% | 28 | 160 | BROAD RALLY
Wed 11 | 917 | 1,485 | 0.62 | 56.4% | 31 | 132 |
Thu 12 | 830 | 1,587 | 0.52 | 54.8% | 30 | 322 |
Fri 13 | 248 | 2,175 | 0.11 | 59.3% | 17 | 509 | BROAD DECLINE
New Lows to Highs ratio on Friday = 30:1. This level of breadth damage historically takes 2-4 weeks to repair.

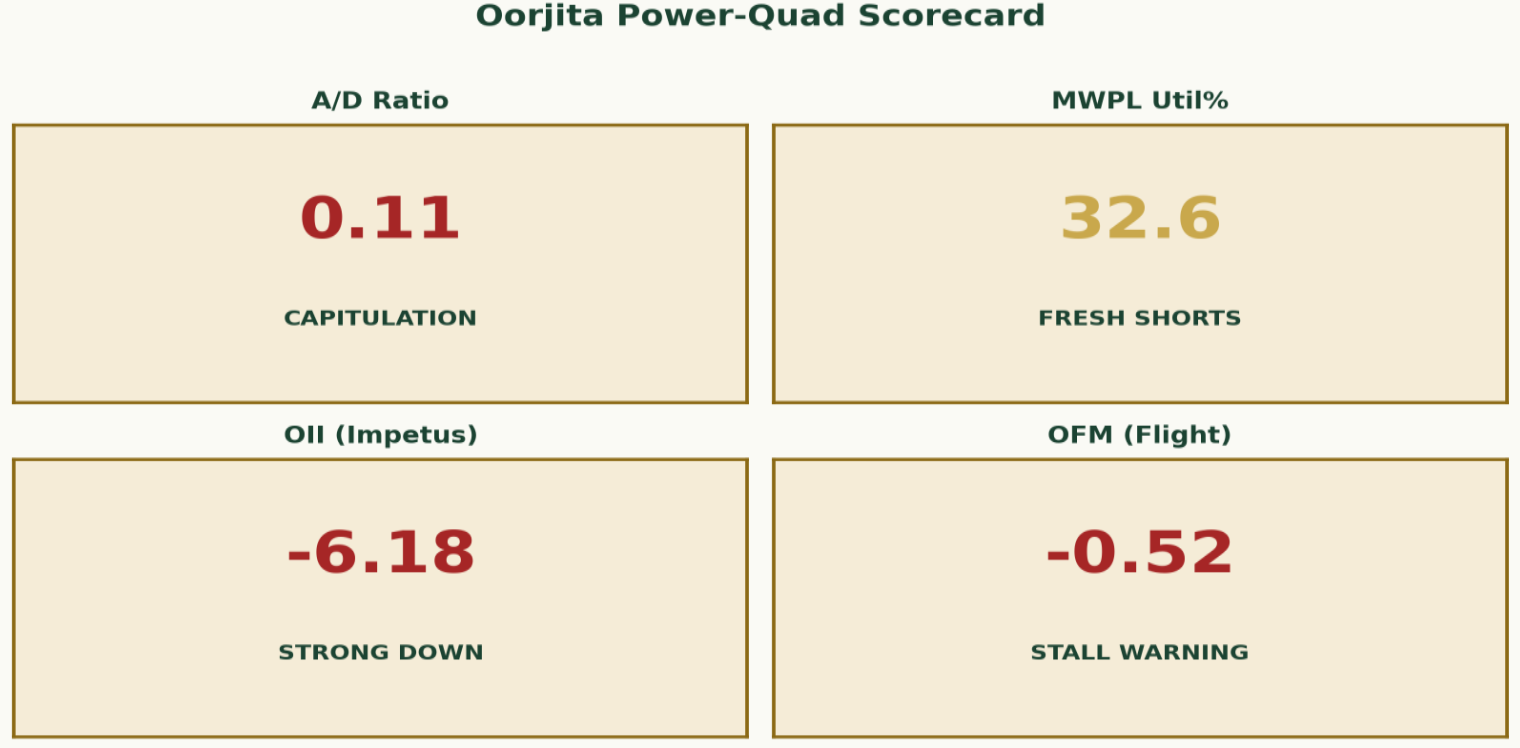
3B — Oorjita Power-Quad Analysis
Layer | Indicator | Value | Signal
1 | A/D Ratio (Fri) | 0.11 | CAPITULATION — 3 of 5 days sub-0.62
2 | MWPL Avg Util | 32.6% | SAIL at limit (96.6%), KAYNES 92.2% — fresh shorts
3 | Oorjita Impetus (OII) | −6.18 | STRONG DOWN — volume-confirmed conviction selling
4 | Oorjita Flight (OFM) | −0.52 | STALL WARNING — VIX drag overwhelms all lift
The Core Message: All four layers aligned bearish. A/D = capitulation breadth. MWPL = fresh shorts. OII = volume conviction. OFM = aircraft in stall. DII buying is the defensive shield, not the recovery engine. Market aircraft status: DESCENDING — stall warning active.
3C — Options Layer
Metric | Nifty (17-Mar) | Bank Nifty (30-Mar)
PCR (Full Chain) | 0.578 | 0.754
Max Pain | 23,500 | 57,100
Call Walls | 25,000 / 24,000 / 24,500 | 61,000 / 59,000 / 60,000
Put Walls | 21,500 / 22,000 / 21,450 | 59,000 / 51,000 / 54,000
Nifty closed 350 pts below max pain. BNF closed 3,342 pts below. Both heavily below equilibrium — option writers captured outsized premium.
3D — Institutional Flows
Day | FII Net (₹ Cr) | DII Net (₹ Cr) | Net Market | FII Intensity
Mon 09 | −6,346 | +9,014 | +2,668 | MODERATE
Tue 10 | −4,673 | +6,333 | +1,661 | MODERATE
Wed 11 | −6,267 | +4,966 | −1,302 | MODERATE
Thu 12 | −7,050 | +7,450 | +400 | HEAVY
Fri 13 | −10,717 | +9,977 | −739 | HEAVY — SPIKE
TOTAL | −35,052 | +37,740 | +2,688 | ACCELERATING
MTD FII: −₹56,883 Cr | MTD DII: +₹70,527 Cr | Rolling 4-week FII: −₹62,150 Cr
FII Positioning: Net short 260,540 index futures contracts. Retail net long 156,278. Extreme divergence — historically precedes mean-reversion within 2-3 weeks.
Smart Money Pattern: Accelerating sell: Mon-Tue moderate (₹5-6K Cr), Wed-Thu ramping, Fri spike (₹10.7K Cr). Systematic/programmatic pattern suggests EM fund mandate rebalancing or risk-limit breaches.

Retail Risk Appetite (F&O Turnover)
Day | Stk Fut% | Idx Opt% | Risk Ratio | Signal
Mon 09 | 39.6% | 39.0% | 0.767 | MIXED
Wed 11 | 45.6% | 31.1% | 1.005 | AGGRESSIVE
Thu 12 | 48.5% | 28.0% | 1.128 | AGGRESSIVE
Fri 13 | 40.6% | 37.5% | 0.797 | MIXED
Mid-week risk appetite spiked AGGRESSIVE (stock futures hit 48.5% of turnover Thursday) — likely trapped long positions facing margin pressure Monday.

4 — REAR VIEW MIRROR + WHAT OTHERS MISSED
What drove this week: Global tariff escalation + Strait of Hormuz disruption fears collided with structural FII repatriation. FII sold every session with an accelerating pattern (₹6.3K Mon → ₹10.7K Fri). DII absorbed ₹37,740 Cr — extraordinary but insufficient. Market fell 1,299 points, every sector red, 509 stocks at 52-week lows Friday.
INSIGHT 1 — The Delivery Paradox: Friday Del% at 59.3% (week's highest) with A/D 0.11. Normally signals distribution. But sector-level data reveals selective accumulation: Auto +8.6pp, Finance +5.5pp. Smart money using the rout as entry while weak hands exit.
INSIGHT 2 — The VIX Ratchet: Each spike leaves the floor higher (14→17→20→22). Implied volatility being permanently re-priced. Premium buyers have the edge over sellers in this regime.
INSIGHT 3 — MWPL Crowding Signal: SAIL (96.6%), KAYNES (+8.4pp to 92.2%), AMBUJACEM (73.6%) — rising MWPL + falling price = fresh shorts. Short squeeze candidates if sentiment reverses.
INSIGHT 4 — FII-Retail Extreme: FII net short 260K index futures contracts vs Retail net long 156K. Divergence near multi-month extreme. Mean-reversion (squeeze or retail capitulation) typically follows within 2-3 weeks.
5 — ECONOMICS, POLICY & GLOBAL CONTEXT
USD/INR (FBIL Source)
Week range: 91.93–92.44. WoW: +0.83% (INR weakening). 92+ is multi-month weak territory.
Cross-asset link (computed): corr(FII Net, USD/INR chg%) = −0.404 over 68 observations. FII selling mechanically weakens INR through repatriation. For IT sector: each 1% INR depreciation adds ~40-50bps to margins — the only natural hedge in this environment.
Next week calendar — Monday 16-Mar (data-dense): China IP + Retail Sales (07:30 IST), India WPI (12:00), India Unemployment (16:00), US Empire State Mfg (18:00).
First-order: China IP miss (<5.0%) triggers metals selling at open. India WPI surprise higher pushes out RBI rate cuts — negative for BFSI. Second-order: Strong China retail data is negative for India's EM fund allocation share. [SPECULATIVE]
Critical March Dates
Date | Event | Impact
17-Mar (Tue) | Nifty weekly options expiry | Positioning around 23,000–23,500
25-Mar (Wed) | F&O MONTHLY EXPIRY (shifted from Thu 26 — Ram Navami) | HIGH — compressed rollover + FY-end collision
26-Mar (Thu) | Ram Navami — Market Holiday | Positions must be squared by Wed 25
31-Mar | Financial Year End | Tax-loss selling + MF NAV window-dressing
8 — LIFE INSURANCE SECTOR DEEP DIVE
India: 2.8% life insurance penetration (vs 7.4% Singapore), 83% protection gap (highest in Asia), median age 28. We dissect the two listed leaders from their 9M FY26 investor presentations — and this week, we add what the mentor demanded: valuation overlay and cash flow quality.
Head-to-Head: 9M FY26
Metric | SBI Life | HDFC Life | Edge
Gross Written Premium | ₹733.5 bn (+20%) | ₹529.7 bn (+13%) | SBI Life
Value of New Business | ₹50.4 bn (+17%) | ₹27.7 bn (+7%; +13% adj) | SBI Life
VoNB Margin | 27.2% (+30bps) | 24.4% (−70bps) | SBI Life
Embedded Value | ₹801.3 bn (+18%) | ₹615.7 bn (+16%) | SBI Life
Total Expense Ratio* | 11.2% (OpEx+Comm/GWP) | 22.5% (TotalExp/TotalPrem) | Not comparable*
Solvency | 1.91× | 1.80× | SBI Life
13M Persistency | 87.1% | 85% | SBI Life
61M Persistency | 58.8% | 63% | HDFC Life
Claim Settlement | 99.3% | 99.8% | HDFC Life
Protection Share (APE) | 11% | 14% | HDFC Life
Operating RoEV | — | 15.6% (12M rolling) | —
PAT | ₹16.7 bn (+4%) | ₹14.1 bn (+7%; +15% adj) | HDFC Life (adj)
*Expense Ratio Note: These ratios are NOT directly comparable. SBI Life's 11.2% is OpEx+Commission/GWP. HDFC Life's 22.5% is Total Expenses/Total Premium. SBI Life's bancassurance model means SBI Bank absorbs much of the distribution infrastructure cost. HDFC Life's ratio includes the full cost of building proprietary agency and non-bank alliance channels. A fairer comparison would use segment-specific expense ratios or ULIP-specific cost structures.

VALUATION OVERLAY (New)
Metric | SBI Life | HDFC Life | Read-through
Share Price (Fri 13-Mar) | ₹1,904.40 | ₹625.75 |
Market Cap (est) | ~₹1,906 bn | ~₹1,346 bn |
Embedded Value | ₹801.3 bn | ₹615.7 bn |
P/EV | 2.38× | 2.19× | SBI Life at slight premium
Annualized VoNB (est) | ~₹67.2 bn | ~₹36.9 bn |
MCap / VoNB | 28.4× | 36.4× | HDFC Life 28% more expensive per VoNB rupee
The valuation reality: SBI Life trades at 2.38× EV — a slight premium to HDFC Life's 2.19×. But on VoNB multiple, HDFC Life is 28% more expensive (36.4× vs 28.4×). The market pays more per rupee of new business value at HDFC Life because of its perceived quality edge (persistency, protection mix, distribution diversification). The question for investors: does HDFC Life's quality premium justify paying 28% more per VoNB rupee? In a stable market, arguably yes. In a correction where ULIP AUM falls across the board, SBI Life's higher VoNB generation and lower valuation make it the better risk-reward.
Cash Flow Quality (New — from Investor Presentation P&L)
Metric | SBI Life (9M FY26) | HDFC Life (9M FY26)
Net Premium Earned | ₹722.7 bn | ₹529.7 bn
Claims/Benefits Paid | ₹380.7 bn (52.7% of premium) | —
Investment Income | ₹359.2 bn | —
Investment Income / PAT | 21.5× (highly investment-dependent) | —
Backbook Surplus | — | ₹47.9 bn
New Business Strain | — | −₹42.3 bn
Backbook / NB Strain Ratio | — | 1.13× (healthy >1.0)
Shareholders Surplus | — | ₹8.5 bn
Change in Actuarial Liability | ₹595.9 bn (reserves growing) | —
Key insight: HDFC Life's backbook surplus (₹47.9 bn) comfortably covers new business strain (₹42.3 bn) with a 1.13× ratio — meaning the existing book generates enough profit to fund new business acquisition costs with room to spare. This is the insurance equivalent of a CFO/PAT ratio >1.0. For SBI Life, investment income at 21.5× PAT shows extreme dependence on investment returns — a feature, not a bug, in a ₹5.1 tn AUM business, but it means equity market corrections directly compress reported profits.
Sensitivity Comparison
Scenario | SBI Life VoNB Impact | HDFC Life VoNB Margin Impact
Interest Rate +100bps | −0.3% | −1.3%
Interest Rate −100bps | +0.1% | +0.9%
Lapse Rate +10% | −4.8% | −1.5%
Mortality +10% / +5% | −5.6% | −1.7%
Mass Lapse ULIP 25% | −9.2% | N/A
Tax Rate → 25% | −9.0% | −4.5%
Q4 FY26 Risk Flag: Surrender value regulation (effective Oct 2024) has only shown partial-year impact so far. Q4 FY26 will be the first quarter with full annualized effect. Both companies show −0.2% VoNB margin impact on 9M basis, but the full-year hit could be larger if surrender behavior changes in a falling market. Monitor closely.
Oorjita Score — Insurance Stocks
Stock | Fundamental | Delivery | Valuation | Verdict
SBILIFE | VoNB ₹50.4bn (+17%), Margin 27.2% | Del 65.9% (accumulation) | P/EV 2.38×, MCap/VoNB 28.4× | BUY on Nifty stabilization
HDFCLIFE | VNB +13% adj, Protection 14% | Del 71.9% (institutional) | P/EV 2.19×, MCap/VoNB 36.4× | HOLD — quality priced in
ICICIPRULI | Balanced mix, strong persistency | Del 69.4% | — | HOLD
Kill-switches: SBILIFE — Nifty below 20,000 triggers mass ULIP surrender (−9.2% VoNB). HDFCLIFE — Expense ratio doesn't normalize in 2-3 quarters = operating leverage reverses.
9 — NIFTY VERDICT & PATTERN RECOGNITION
Weekly Candlestick: Large bearish marubozu (O:23,868 C:23,151). Minimal upper shadow. Strong selling conviction. RSI below 30 — oversold zone. Historically, RSI<30 on Nifty weekly resolves with a 3-5% bounce in 8 of 12 instances over the last decade. But the 4 exceptions (2018 NBFC, 2020 Covid, 2022 Ukraine) were structural triggers — like the current one. Oversold is not a buy signal without a catalyst.
Confirmation: Below 23,000 Monday = continuation. Hold + reversal candle (hammer/engulfing) = weakened bearish signal. Implication: BEARISH — HIGH probability.
Level | Value | Basis
Resistance 1 | 23,500 | Max Pain (options magnet)
Resistance 2 | 24,000 | Call wall + prior support-turned-resistance
Support 1 | 23,000 | Psychological + round number
Support 2 | 22,500 | Put wall cluster zone
Extreme Support | 21,500 | Major put wall + structural support
Call to Action: Nifty holds 23,000 + reversal candle = trade toward 23,500 (stop at 22,800). 23,000 breaks on volume + FII >₹5K Cr selling = stand aside, next stop 22,500.
10 — THE WEEK AHEAD
Scenarios
Scenario | Prob | Nifty Range | Trigger | Kill-Switch
Bear (continuation) | 50% | 22,500–23,200 | FII >₹5K Cr/day; tariff implementation; Hormuz escalation | FII turns buyer 2+ days
Base (consolidation) | 35% | 23,000–23,700 | FII moderates to ₹2-3K Cr; DII holds; positive China data | VIX spikes above 28
Bull (snap-back) | 15% | 23,500–24,200 | FII net buyer; VIX <18; tariff de-escalation | Fresh tariff announcement
Monte Carlo Path Simulation (DUAL REGIME — Fixed)
Metric | Base Case (moderate bear) | Stress Case (this week's regime)
Daily return / vol | −0.30% / 1.20% | −1.08% / 1.09%
5th percentile (worst) | 21,801 | 21,034
Median | 22,798 | 21,927
95th percentile (best) | 23,834 | 22,845
P(Nifty < 23,000) | 62.6% | 97.4%
P(Nifty < 22,000) | 9.2% | 55.4%
P(Nifty > 24,000) | 2.7% | 0.0%
Read: Base case (moderate correction continues) puts median at 22,798 — still below current close. Even the best-case 95th percentile barely clears 23,800. The stress case (this week repeats) puts median at 21,927. Both scenarios confirm: recovery above 24,000 next week is extremely unlikely (<3%). The question is whether we land at 22,800 (base) or 21,900 (stress). FII flow data Monday will tell us which regime we're in.
Caveat: Base case uses −0.30% daily mean (long-term moderate bear), NOT this week's extreme. Stress case uses this week's actual parameters. The truth likely falls between. 10,000 simulations × 5 days each. [MEDIUM confidence — regime-dependent]
Black Swan Scanner
Tremor | Prob | Impact | Monitoring Signal
US tariffs on Indian exports | 10-15% | Nifty −5 to −8%; Pharma/IT hardest | White House exec order language
Strait of Hormuz escalation | 10% | Crude $85+; INR 94+; OMCs hammered | Oil above $80 for 3+ days
China CNY devaluation | 5-8% | INR 93-94; metals dumping; EM contagion | PBOC fixing rate moves
NBFC/HFC credit event | 3-5% | BFSI −10%+; systemic risk repricing | Corporate bond spread widening
Hormuz tension is new this week — confirmed as a contributing factor to Friday's sell-off. Combined with tariffs and FII selling, this creates a three-front risk scenario. Probably nothing. But monitor.
Seasonality
March is historically India's most holiday-dense month (3 holidays in 2026). F&O monthly expiry shifted to March 25 (Wed) due to Ram Navami. FY-end tax-loss selling + MF NAV window-dressing creates selling pressure in first 3 weeks, with potential relief rally in last 2-3 sessions. This year's pattern is amplified by FII overhang.
Watchlist
SAIL — MWPL at 96.6% (ban imminent). Falling price. If ban triggers, forced unwinding = short squeeze. Kill-switch: China steel dumping.
SBILIFE — VoNB +17%, margin 27.2%, delivery accumulation, P/EV 2.38×. First insurer to re-rate if market stabilizes. Kill-switch: Nifty <20K mass surrender risk.
KAYNES — MWPL surged +8.4pp to 92.2%. Price falling 6.1%. Aggressive fresh shorts. Squeeze potential high. Kill-switch: earnings miss.
L&T — OI spurt +23.15% (highest Friday). Fresh positions at current levels. Order book visibility strong. Kill-switch: capex cycle slowdown.
11 — INTERACTIVE BITS
11a — Prediction Tracker
Framework established this edition. Since we had a Black Swan event of Oil Spike by 20% on Sunday/ Monday Morning this drove the market moves this weeks.Scoring begins Edition #12.
Every call from this edition forward will be scored Win/Loss/Messy Middle with honest attribution. Losses will be highlighted, not hidden.
11b — Weekly Poll
Q: What happens to Nifty next week?
A) Bounces above 23,500 (short-covering rally) | B) Consolidates 23,000–23,400 | C) Breaks below 23,000
11c — Reader Q&A
Q: Should I buy life insurance stocks on this dip?
A: Depends on horizon. SBI Life at 2.38× P/EV with 27.2% VoNB margin is structurally sound. But ULIP concentration (58%) means a further Nifty decline directly hits AUM. If you're a 2-3 year holder believing in India's insurance penetration story (2.8% → 4%+), this correction creates entry. If trading 30 days, wait for FII moderation. Delivery accumulation signal is encouraging but needs price confirmation. HDFC Life at 2.19× P/EV looks cheaper on EV, but at 36.4× VoNB is expensive — wait for expense ratio normalization signal.
12 — MARKET ARCHAEOLOGY
Pattern Echo: October 2024 FII sell-off. FII sold ~₹94K Cr that month. Nifty fell ~8%. Similarities: structural FII selling, DII absorption, VIX spike, INR weakness. Resolution: floor found within 3 weeks once FII pace halved; 60% drawdown recovery in 6 weeks.
Where it breaks: Oct 2024 had a visible catalyst (China stimulus fading). Today's tariff + Hormuz trigger has no clear resolution timeline. Floor-finding may take 4-6 weeks vs 2-3.
Decade context: India's MSCI EM weight: ~8% (2016) → ~19% (2025). Higher weight = larger position sizes = larger selling when EM funds rebalance. Part of FII selling is mechanical (index rebalancing), part is discretionary (risk-off). Mechanical selling has finite quantum; discretionary is unpredictable.
13 — RED FLAGS & RISK MANAGEMENT
Flag | Severity | Data | Watch Trigger
FII Structural Selling | 🔴 HIGH | −₹57K Cr MTD; net short 260K contracts | FII net buyer >₹3K Cr = inflection
Breadth Collapse | 🔴 HIGH | A/D 0.11; 509 at 52W low; 30:1 lows:highs | A/D >1.0 for 2 days = recovery
VIX Regime Shift | 🟠 MEDIUM | 22.65; floor rising weekly | <18 = ebbing; >28 = panic
INR Weakness | 🟠 MEDIUM | 92.44 — multi-month weak | 93+ = broader EM risk-off
Hormuz/Oil Risk | 🟡 LOW (rising) | Strait tensions cited in sell-off | Crude >$80 for 3+ days
Stress Test: FII ₹50K Cr weekly outflow → ~7-8% decline → Nifty 21,500-22,000. VIX 28-30. RBI FX intervention. Probability: LOW (10-15%).
Portfolio Stress (2σ scenario): Crude $85 + INR 94 + US 10Y 4.8% simultaneously → Nifty −8 to −12% (20,400-21,300). Most exposed: Auto, Banking, Metals. Most resilient: IT, Pharma. Action: reduce cyclical overweight, increase IT/Pharma, hold 15-20% cash.
COMPLIANCE, QUALITY GATES & CLOSING NOTE
Regulatory Disclaimers
This newsletter is published by Oorjita FinAI Services for informational and educational purposes only. Nothing herein constitutes investment advice, a recommendation to buy or sell any security, or an offer to provide investment management services. All data is sourced from publicly available information — NSE, BSE, FBIL/RBI, Chittorgarh, and other publicly accessible platforms. Past performance is not indicative of future results. Subscribers should consult a SEBI-registered investment advisor before making any investment decisions. Oorjita FinAI Services and its analysts may hold positions in securities discussed. India VIX, PCR, and flow data are sourced from exchange files as-at-time-of-extract; final exchange-published values may differ marginally. The views expressed are those of the analyst team and do not constitute research as defined under SEBI (Research Analysts) Regulations, 2014.
A Note on How We Got Here
This is a workshop, not a museum. The week of 16–20 February 2026 will be remembered not for the headline Nifty print (+0.39% — boring) but for what moved beneath: PSU Banks restructuring the financial sector narrative, FMCG quietly confirming a rural consumption inflection, IT wrestling with its longest bear phase in a decade, and a VIX that rose 8% while the index smiled. The receipts are all here — every number has a source tag, every call has a kill-switch, and every prediction will be scored. That's the promise.
Disclaimers
This newsletter is for informational and educational purposes only and does not constitute investment advice, financial advice, trading advice, or any other sort of advice. The content is provided "as is" without warranty of any kind.
Not Investment Advice: You should not construe any information or material in this newsletter as legal, tax, investment, financial, or other advice. Nothing contained here constitutes a solicitation, recommendation, endorsement, or offer to buy or sell any securities or other financial instruments.
Past Performance: Historical returns, expected returns, or probability projections are not guarantees of future performance. The value of investments can go down as well as up, and you may not get back the full amount invested.
Risk Warning: All investments involve risk, including the possible loss of principal. Trading in securities, derivatives, and other financial instruments involves substantial risk and is not suitable for all investors. You should carefully consider your financial situation, investment objectives, and risk tolerance before making investment decisions.
Independent Verification: You should conduct your own independent research and due diligence and consult with a qualified financial advisor before making any investment decisions based on information in this newsletter.
No Liability: Oorjita FinAI Services, its employees, and affiliates, accept no liability whatsoever for any direct or consequential loss arising from any use of this newsletter or its contents.
Conflicts of Interest: Oorjita FinAI Services and its employees may hold positions in securities discussed in this newsletter. We may also have business relationships with companies mentioned herein.
Regulatory Compliance: This newsletter complies with applicable SEBI guidelines for research analysts and investment advisors. Registration details are available on request.
Data Accuracy: While we strive for accuracy, errors may occur. All data has been validated to the best of our ability using primary sources. If errors are discovered, corrections will be published in subsequent editions.
Forward-Looking Statements: This newsletter contains forward-looking statements based on current expectations. Actual results may differ materially. We undertake no obligation to update these statements.
© 2026 Oorjita FinAI Services. All rights reserved.
Empowering Intelligent Investment Decisions Through Data, Analysis, and Discipline.
Contact: insights@oorjita.com | www.oorjita.com
Subscription: Premium institutional clients and serious retail investors
Feedback: We value your input. Email research@oorjita.com
Website: oorjita.ai
Location: Bengaluru, Karnataka, India
Contact: insights@oorjita.ai
Newsletter Editions:
Morning Brief (Pre-Market Analysis) - Daily 7:30-8:00 AM IST
Evening Update ("What We Missed") - Daily 7:00-7:30 PM IST
Weekly Market Manthan - Every Sunday
Quarterly Company Deep-Dives (Samiksa Oorjita Series)
Value Ratna Series Polishing potential into profit.
COMPLIANCE & DISCLAIMERS
Regulatory Disclosure
www.oorjita.ai is not operated by a broker, a dealer, or a registered investment adviser. Under no circumstances does any information posted on www.oorjita.ai represent a recommendation to buy or sell a security. The information on this site, and in its related newsletters, is not intended to be, nor does it constitute investment advice or recommendations. The information on this site is in no way guaranteed for completeness, accuracy or in any other way. In no event shall Oorjita Fin AI Services be liable to any member, guest or third party for any damages of any kind arising out of the use of any content or other material published or available on www.oorjita.ai, or relating to the use of, or inability to use, www.oorjita.ai or any content, including, without limitation, any investment losses, lost profits, lost opportunity, special, incidental, indirect, consequential or punitive damages. Past performance is a poor indicator of future performance.
Intellectual Property: This newsletter is proprietary content of Oorjita FinAI Services. Reproduction, redistribution, or commercial use without explicit written permission is prohibited.
Prepared by: Oorjita FinAI Research Team
Contact: : insights@oorjita.ai| www.oorjita.ai
Copyright © 2025 Oorjita FinAI Services. All rights reserved.
Subscribe to unlock premium content
Independent research, deep company analysis, and quarterly insights -
designed to help you think clearly, not trade noisily.
DHARMAJ CROP GUARD LIMITED

NATCO PHARMA LIMITED

10 Productivity tools that are worth checking out

DHARMAJ CROP GUARD LIMITED
NATCO PHARMA LIMITED
DHARMAJ CROP GUARD LIMITED