
February 16th–20th, 2026 – Week Wrap | PSU Banks Surge 5.45%, Nifty Ends Up 0.39% Despite Weak Breadth, VIX Rises, and DIIs Offset Persistent FII Selling


Daily market intelligence that helps you track what matters, learn from what played out, and stay prepared for what’s next.

Popular articles


MARKET MANTHAN
Perfect hindsight for sharper foresight (most days)
Header & Identity
Edition Scorecard — YTD at a Glance
Index | YoY Change | 52W High | 52W Low | Signal
Nifty 50 | +11.60% | 26,373 | 21,744 | Near upper half of range
Nifty Midcap 100 | +16.32% | 61,549 | 46,866 | Softer breadth this week
Nifty Smallcap 100 | +7.97% | 19,225 | 14,084 | Underperforming
Nifty IT | −21.69% | 40,301 | 30,919 | YoY laggard
Nifty PSU Bank | +59.72% | 9,691 | 5,530 | YoY leader
India VIX | From 16.54→14.36 | 23.19 | 8.72 | Still benign, but stirring
Prediction Tracker (Edition #6 calls — scoring this week)
Call | Outcome | Score
Banks to outperform broad market | Bank +1.64% vs Nifty +0.39% | WIN
IT under pressure from US macro | IT -2.07% WoW on FOMC hawkishness | WIN
FII return to buying not sustained | Net sellers -₹637 Cr for week | WIN
VIX to stay below 15 | VIX touched 14.78 intraday, closed 14.36 | NARROW WIN
Smallcap to underperform large | SC100 -0.18% vs Nifty +0.39% | WIN
Market Data Deep Dive
Nifty 50 — Day-by-Day Evolution
Date | Open | High | Low | Close | Change | VIX | Key Character
Mon 16-Feb | 25,423.60 | 25,697.00 | 25,372.70 | 25,682.75 | +211.65 / +0.83% | 13.33 | Bull gap-up; broad recovery
Tue 17-Feb | — | — | — | 25,546.75 | −136.00 / −0.53% | ~13.1 | Profit booking; IT drags
Wed 18-Feb | — | — | — | 25,456.15 | −90.60 / −0.35% | ~13.4 | Cautious; FOMC minutes awaited
Thu 19-Feb | — | — | — | 25,454.35 | −1.80 / −0.01% | ~13.5 | Holiday-thin; near flat
Fri 20-Feb | 25,406.55 | 25,663.55 | 25,379.75 | 25,571.25 | — | 14.36 | Bank-led recovery; VIX spike
Note: 19-Feb (Chhatrapati Shivaji Maharaj Jayanti) — FBIL did not publish a fresh forex rate (carried 18-Feb forward); NSE equity market was operational; FII/DII data present.
Intraweek Narrative: The market opened the week with strong conviction (+0.83% Monday), gave back gains Tuesday through Thursday as FOMC minutes (released Wednesday night IST) showed hawkish dissent, then recovered Friday led by PSU Banks and FMCG. The net result: a modest +0.39% week that masks significant intraweek rotation.
Sectoral Performance — Full Week Scorecard
All changes: 13-Feb-2026 close → 20-Feb-2026 close.
Sector Index | 13-Feb Close | 20-Feb Close | WoW Change | Signal | Delivery % (Fri)
Nifty PSU Bank | 9,166.50 | 9,665.80 | +5.45% | Week's star | 48.2%
Nifty Energy | 35,709.90 | 36,581.15 | +2.44% | Crude tailwind | 49.4%
Nifty FMCG | 50,902.15 | 51,772.70 | +1.71% | Stealth accumulation | 63.7%
Nifty Bank (Overall) | 60,186.65 | 61,172.00 | +1.64% | Broad banking strength | 60.8%
Nifty Pharma | 22,194.90 | 22,452.40 | +1.16% | Consistent strength | 71.0%
Nifty Metal | 11,872.80 | 11,989.95 | +0.99% | China PMI revival | 44.0%
Nifty Infrastructure | 9,542.50 | 9,632.25 | +0.94% | Quiet builder | 54.7%
Nifty 50 | 25,471.10 | 25,571.25 | +0.39% | Benchmark | Mixed
Nifty Midcap 100 | 59,438.00 | 59,513.95 | +0.13% | Stalling | ~47%
Nifty Realty | 823.60 | 820.70 | −0.35% | Under mild pressure | 54.9%
Nifty Auto | 28,234.30 | 27,846.80 | −1.37% | Volume data disappoints | 58.8%
Nifty IT | 32,681.50 | 32,004.05 | −2.07% | Week's laggard | 46.1%
Nifty Smallcap 100 | 17,032.90 | 17,002.15 | −0.18% | Breadth weakening | ~41%
Sector Read: The week's trade was a tale of two halves. PSU Banks (+5.45%) exploded on continued institutional rotation away from private banks after strong Q3 results from SBI and Canara Bank. Energy benefited from Brent's near-5% weekly surge to $71.60/bbl. FMCG's delivery rate of 63.7% is a quiet signal — institutions don't accumulate with intraday noise; when delivery is high, conviction is real. IT's -2.07% reflects FOMC minutes-driven USD strength and tempered US tech spending outlook.
FII/DII Daily Flows — The Full Picture
Date | FII Buy (₹ Cr) | FII Sell (₹ Cr) | FII Net | DII Buy (₹ Cr) | DII Sell (₹ Cr) | DII Net | Market Character
16-Feb (Mon) | 9,169.39 | 10,141.52 | −972.13 | 13,121.31 | 11,454.33 | +1,666.98 | DII absorbs FII selling
17-Feb (Tue) | 8,867.62 | 7,872.41 | +995.21 | 12,482.64 | 12,295.60 | +187.04 | FII brief buyer; DII thin
18-Feb (Wed) | 9,720.92 | 8,566.58 | +1,154.34 | 12,143.76 | 11,703.42 | +440.34 | Both buying; FOMC night
19-Feb (Thu) | 8,614.90 | 9,495.39 | −880.49 | 11,483.86 | 12,080.14 | −596.28 | Post-FOMC: both sell
20-Feb (Fri) | 10,010.06 | 10,944.67 | −934.61 | 14,901.90 | 12,264.75 | +2,637.15 | DII rescues the close
WEEK TOTAL | 46,382.89 | 47,020.57 | −637.68 | 64,133.47 | 59,798.24 | +4,335.23 | DII backstop intact
Source: NSE FII/DII Consolidated file. Confidence: HIGH. Note: 19-Feb FBIL rate not published (state holiday); flows data present and verified.
Flow Narrative: FII was a net seller for the week (−₹637.68 Cr), but the range was enormous — intraday swings suggest algo-driven tactical positioning around FOMC minutes rather than a structural change of heart. DII was the market's backbone, posting a cumulative +₹4,335.23 Cr. Friday's DII surge of +₹2,637.15 Cr was the week's single biggest institutional defense - likely mutual fund SIP deployments and domestic fund rebalancing. The structural picture: FII has been a net seller in 10 of the last 14 weeks (since mid-Nov 2025); DII has offset every single one of them. This is not an accident — it is the architecture of a market in transition.
6-Month FII/DII Monthly Context
Month | FII Net (₹ Cr) | DII Net (₹ Cr) | Nifty Direction
Sep-25 | −34,176 | +63,050 | Down
Oct-25 | −2,347 | +52,794 | Flat/Up
Nov-25 | −17,500 | +77,084 | Mixed
Dec-25 | −9,668 | +20,161 | Down
Jan-26 | −38,167 | +67,695 | Down then Up
Feb-26 (partial) | −637 (1 week) | +4,335 (1 week) | Up +0.39% WoW
Six-month FII cumulative: approximately −₹102,000 Cr.
DII cumulative: approximately +₹285,000 Cr.
DIIs have more than absorbed FII outflows by a ratio of nearly 3:1.
India VIX — 8-Week Trend & Regime Analysis
Week End | VIX Close | WoW Change | Regime
26-Dec-25 | 13.70 | — | Sleepy
2-Jan-26 | 12.83 | −6.4% | Sleepy
9-Jan-26 | 15.02 | +17.1% | Normal
16-Jan-26 | 14.45 | −3.8% | Normal
23-Jan-26 | 15.42 | +6.7% | Normal
30-Jan-26 | 13.62 | −11.7% | Sleepy
6-Feb-26 | 11.37 | −16.5% | Very sleepy
13-Feb-26 | 13.29 | +16.9% | Normal
20-Feb-26 | 14.36 | +8.05% | Normal / Twitchy
VIX Read: After touching an 8-week low of 11.37 on 6-Feb, VIX has rebounded sharply — +26.3% in two weeks. The driver: FOMC minutes released Wednesday (18-Feb IST) showed unexpected hawkish dissent within the Fed, causing DXY to climb to a 4-week high of 97.73. When the dollar firms and US rates uncertainty rises, India VIX tends to follow with a 2-3 day lag. We are not in a "spicy" regime yet (that begins above 18–20), but the direction of VIX is the one number pros watch quietly while everyone discusses Nifty levels. A VIX climbing toward 16 while the index holds is not unusual — it is actually what smart-money hedging looks like.
2.5 Market Breadth — Advance / Decline / 52W Highs & Lows
Date | Advances | Declines | Unchanged | A/D Ratio | Market Character
16-Feb (Mon) | 1,341 | 1,826 | 97 | 0.73 | Index up, breadth bearish
17-Feb (Tue) | 1,929 | 1,216 | 105 | 1.59 | Broad participation
18-Feb (Wed) | 1,713 | 1,456 | 108 | 1.18 | Mild positive
19-Feb (Thu) | 831 | 2,307 | 111 | 0.36 | Brutal breadth collapse
20-Feb (Fri) | 1,520 | 1,621 | 107 | 0.94 | Near flat, banks rescue headline
52-Week Highs vs Lows (as at 20-Feb-2026):
• 52W Highs: 39 stocks
• 52W Lows: 140 stocks
• Ratio: 1 high for every 3.6 new lows — deeply unfavourable internal structure.
Breadth Verdict: Thursday's A/D of 0.36 is the week's most important data point — and it didn't make the headlines. When 2,307 stocks fall on a day the index barely moves (-0.01%), it tells you the index is being held up by a handful of heavyweights while the broader market bleeds. This is not healthy accumulation. The 140 stocks touching 52-week lows versus only 39 highs is a structural warning. It means the small-to-mid-cap recovery story being sold in morning reports is, at best, a work in progress. At worst, it's a large-cap illusion.
2.6 Top Movers — Nifty 50 (Friday, 20-Feb-2026)
Gainers:
Symbol | Close | Change | Key Reason
HINDALCO | 934.75 | +3.21% | China PMI flash data; metal sector tailwind
NTPC | 372.80 | +2.64% | Govt capex; coal linkage positive
LT | 4,380.10 | +2.33% | Order book optimism; infra budget flow
SBILIFE | 2,080.00 | +1.81% | Insurance sector re-rating
HINDUNILVR | 2,318.30 | +1.71% | FMCG accumulation; rural demand data
COALINDIA | 423.00 | +1.65% | Dividend-yield play; PSU rotation
POWERGRID | 299.00 | +1.48% | Consistent DII favourite
TATASTEEL | 208.21 | +1.36% | Metals + China positive read-through
NESTLEIND | 1,295.50 | +1.33% | Delivery% 63%+ — accumulation signal
ONGC | 278.25 | +1.31% | Crude at 6-month high
Losers:
Symbol | Close | Change | Key Reason
INFY | 1,353.00 | −1.28% | FOMC hawkishness = USD strength = IT pain
TECHM | 1,464.00 | −1.03% | Q3 margin concerns
GRASIM | 2,835.00 | −1.02% | Building materials demand soft
HCLTECH | 1,438.80 | −0.80% | IT sector broad drag
WIPRO | 210.03 | −0.56% | Guidance anxiety
BHARTIARTL | 1,977.80 | −0.54% | Profit booking after strong run
2.7 Options Flow — F&O Intelligence
NIFTY 50 — 24-Feb-2026 Expiry (Near-Term)
Metric | Value | Interpretation
Spot | 25,571.25 | —
Max Pain | 25,600 | 29 pts above spot; writers want expiry near here
PCR (OI-based, ±2500 band) | 0.78 | Below 1.0 = call-heavy = mild bearish bias
Largest Call OI (resistance) | 27,000 (2,43,925 contracts) | Major ceiling; unlikely this expiry
2nd Call OI | 26,000 (2,17,495 contracts) | More realistic near-term cap
3rd Call OI | 26,500 (2,09,585 contracts) | Secondary resistance
Largest Put OI (support) | 25,000 (1,84,211 contracts) | Floor for this expiry
2nd Put OI | 24,000 (1,77,986 contracts) | Deeper structural support
Immediate Put support | 25,500 (1,40,922 contracts) | First line of defence
PCR (2-Mar expiry) | 0.85 | Improving into next expiry — less bearish
BANKNIFTY — 24-Feb-2026 Expiry
Metric | Value
Spot | 61,172
Max Pain | 60,900
PCR | 0.80
Key Call resistance | 63,000 / 62,500 / 62,000
Key Put support | 60,000 / 61,000 / 59,000
Options Read: A PCR of 0.78 on the near expiry means call writers are comfortable selling upside — they don't fear a breakout above 26,000–26,500 this week. The concentration of put OI at 25,000 makes that strike the "institutional floor" for this expiry. With max pain at 25,600 and spot at 25,571, the market is essentially sitting on max pain — which means option writers are in equilibrium. Expect pinning action around 25,500–25,600 through the 24-Feb expiry unless a catalyst breaks the tape.
2.8 Delivery vs. Intraday — Conviction Detector
High delivery % = institutional/retail holding, not flipping.
Sector | Avg Delivery % | Signal
Pharma | 71.0% | Strong accumulation
FMCG | 63.7% | Quiet buildup — watch this
Private Bank | 60.8% | Conviction buying
Auto | 58.8% | Selective
Realty | 54.9% | Neutral
Infra | 54.7% | Neutral
Power | 54.0% | Neutral
Oil & Gas | 49.4% | Neutral
NBFC | 49.2% | Neutral
PSU Bank | 48.2% | Surprisingly low given price action — momentum, not conviction
IT | 46.1% | Selling/intraday — not accumulation
Metal | 44.0% | Tactical, not structural
The disconnect to note: PSU Banks surged +5.45% on the week but have the second-lowest delivery percentage (48.2%) among sectors. This is a momentum/rotation trade, not deep institutional accumulation. Pharma (71%) and FMCG (63.7%), by contrast, show genuine conviction — these are the sectors where smart money is quietly building.
3 WHAT OTHERS MISSED
3.1 PSU Bank: The +5.45% Nobody Budgeted For
PSU Bank's weekly surge is the loudest signal in a quiet tape. The NIfty PSU Bank index hit a fresh 52-week high of 9,691 intraday on Friday — a level not seen since the index was on its way up in early 2025. What drove it? Three converging forces: (1) Q3FY26 results from SBI, Canara Bank, and Bank of Baroda showing NIM stabilisation and declining NPAs; (2) government's stated priority of PSU bank recapitalisation in the Union Budget; (3) FII rotation out of expensive private banks (HDFC Bank P/B ~3.1x) into cheap PSU banks (SBI P/B ~1.5x, PNB P/B ~1.1x). The delivery percentage of 48.2% however flags this as momentum, not conviction — which means a pullback on any negative trigger (RBI circular, asset quality revision) could be sharp. Entry note: scale in, don't chase.
3.2 IT: −2.07% WoW — Capitulation or Correction?
Nifty IT is now −21.69% on a 1-year basis — the worst-performing major sector by a significant margin. This week's -2.07% was catalysed by FOMC minutes (released Wed 18-Feb IST) which revealed hawkish dissent inside the Fed, pushing DXY to 97.73. A stronger dollar should logically help Indian IT exporters (revenues in USD, costs in INR) — yet the market sold IT. Why? Because markets price the macro narrative, not the arithmetic. The narrative this week was: hawkish Fed = US corporate spending caution = IT deal pipeline risk. Additionally, INFY's -1.28% and TECHM's -1.03% on Friday had specific drivers (guidance anxiety, margin concerns) beyond just macro.
The deeper question: at P/E of 22.7x for Nifty IT after a 21% fall, is it cheap? Relative to history (5-year average ~28x), yes. But earnings visibility is the issue — not valuation. Until US IT spending clarity emerges (Q1CY26 US Big Tech capex guidance in April), IT remains a range-bound, sentiment-driven trade.
3.3 FMCG: The Stealth Rally Nobody Talks About
FMCG rose +1.71% this week with a delivery percentage of 63.7% — the second-highest among all sectors. This is not accidental. GST collections for January 2026 came in at ₹1.93 lakh crore (+6.2% YoY), India's manufacturing PMI hit 57.5 (Feb flash), and auto OEM volumes in January were healthy — all pointing to a consumption recovery that FMCG benefits from with a 2–3 month lag. The Nifty FMCG index, despite being -3.42% on a 1-year basis, has quietly turned its 30-day momentum positive (+0.12%). Watch for a re-rating if Q4FY26 rural volume data (March) confirms the trend.
3.4 VIX +8% vs a Calm Index — The Paradox Explained
The Nifty moved only +0.39% for the week, yet VIX jumped +8.05%. This apparent paradox resolves when you look at the intraday action: Thursday's A/D of 0.36 (2,307 declines) and Monday's initial gap-down before recovery, combined with the FOMC minutes surprise, caused option buyers to pay up for protection even as the index held. This is called fear below the surface — institutions hedging mid-cap/smallcap books while maintaining large-cap long positions to keep the index stable. When VIX rises while the index is flat, the professional interpretation is: someone knows something, or fears something, that hasn't shown up in prices yet. Watch if VIX breaks above 16 — that's the signal that hedging is converting to outright selling.
3.5 Mid/Small Divergence — Risk Appetite Still Absent
Nifty Midcap 100: +0.13% | Nifty Smallcap 100: −0.18% vs Nifty 50: +0.39%. The large/mid/small spread continues. The 52-week high/low data tells the real story: 39 new highs vs 140 new lows. In a genuine bull market broadening, you'd see 100+ new highs with <30 new lows. The current ratio of 1:3.6 says this is a selective market where institutions are cherry-picking quality large caps, not a broad risk-on rally. This matters for subscribers running diversified small/mid-cap portfolios: the tailwinds are not evenly distributed. Selectivity is the strategy.
3.6 Auto: The Dog That Didn't Bark
Nifty Auto fell −1.37% in a week when crude oil rose ~5% and should (in theory) have been a headwind for auto. Yet the sector's fall was actually about something else: January 2026 auto volumes, while "healthy" on the headline, showed slowing retail off-take in PVs and flattening momentum in 2W. Maruti and M&M both closed near-flat to negative on Friday. The sector is in a peculiar spot: GST cuts have pulled forward demand, rural recovery is nascent, and EV disruption anxiety is slowly creeping into valuations. A bottom is forming — but the catalyst (a strong Q4 pre-buy or budget-linked demand jump) hasn't arrived yet.
4 ECONOMICS & POLICY
4.1 RBI MPC — The Pause That Refreshes (Or Worries)
The Reserve Bank of India's February 2026 MPC (decided 5-Feb, relevant context for this week's market) held the repo rate unchanged at 5.25% — a unanimous decision.
What this means, precisely:
• Repo rate: 5.25% | SDF: 5.00% | MSF/Bank Rate: 5.50%
• The RBI has delivered a cumulative 125 basis points of cuts since February 2025
• Policy stance: Neutral — neither explicitly easing nor tightening
• FY26 GDP estimate: ~7.3% — RBI called this a "Goldilocks phase"
• Inflation: Near 4% target, giving RBI room to pause without credibility loss
The honest read: The pause is logical. With 125 bps of cuts already in the system, the RBI is letting transmission complete. Home loan rates have softened. MSME credit is growing. The neutral stance is a message: we're done for now, unless something breaks. What could break? A food inflation spike (El Niño probability tracking), a significant rupee depreciation (currently manageable at 90.95), or a global shock. None of these are base case.
Market implication: Banks — especially PSU banks with high CASA ratios — benefit from the current environment (rates have fallen but NIMs are stabilising). NBFC sector is a more nuanced call; cheaper money is positive, but asset quality must be watched as the rate-cut cycle ends.
4.2 US Fed — Hawkish Minutes, Divided Committee
The FOMC minutes for the January 27–28, 2026 meeting were released Wednesday, 18-Feb-2026 - right in the middle of our trading week.
Key points from the minutes:
• Rates held at 3.75% (unchanged) - unanimous decision.
• Internal division revealed: some members open to rate hikes if inflation doesn't slow; others want more cuts if growth softens.
• The phrase "higher for longer" is back in Fed vocabulary — not as policy, but as possibility.
• Market pricing: 2 cuts priced for 2026, with 40% probability of a 3rd.
Dollar impact: DXY rose to 97.73 on the hawkish tone — a 4-week high. This was the direct catalyst for Thursday's broad market decline and IT sector underperformance. A sustained DXY above 98 would be a material negative for EM equity flows, including India.
India linkage: Every 1% dollar appreciation historically leads to ~0.5–0.7% FII outflows from Indian equities (Confidence: Medium — based on 2022–2024 correlation). With USD/INR already at 90.95, further dollar strength is the macro risk to watch.
4.3 Crude Oil — Geopolitical Risk Premium Returns
Brent crude closed at $71.60/bbl on 20-Feb-2026 — a 6-month high, up ~5% WoW. The driver: US President Trump's deadline for Iran to reach a nuclear agreement, injecting a geopolitical risk premium. WTI settled at ~$66.30/bbl.
India sectoral cascade:
• Oil & Gas (OMCs): Negative for downstream (HPCL, BPCL) - margin compression risk. Positive for upstream (ONGC, OIL India) - realisation gains. Net effect: mixed, but upstream wins near-term.
• Paints: Crude derivatives (titanium dioxide, monomers) are ~35-40% of input costs for Asian Paints, Berger. A sustained $5/bbl rise = ~150-200 bps margin headwind. Watch for management commentary in Q4FY26 earnings.
• Airlines: IndiGo's single biggest cost is ATF (Aviation Turbine Fuel), directly crude-linked. A 5% crude rise = ~₹200-250 Cr quarterly headwind at current operations.
• Tyres: Natural rubber (separate) + carbon black (crude-derived). Mild negative.
• Plastics/Chemicals: Input cost pressure; mid-cap chemical companies most affected.
4.4 India PMI & GST — The Consumption Signal
• India Manufacturing PMI (Feb 2026 flash): 57.5 vs 55.4 in January — 3-month high, firmly in expansion. New orders and employment sub-indices both positive.
• India Services PMI (Feb 2026): 58.4 vs 58.5 in January — marginal tick down, but both manufacturing and services in expansion simultaneously — rare and bullish.
• GST Collections (January 2026): ₹1.93 lakh crore (+6.2% YoY) - the mix matters here. Goods (CGST+SGST) growth of ~7% suggests domestic consumption is real, not just headline. Service sector (IGST) growth of ~5.5% (estimated) reflects IT and professional services moderation. The 6.2% headline is solid but below the 8–9% trend seen in mid-2025 - a mild deceleration to note.
Policy case study: The last time India PMI was above 57 for two consecutive months while GST collections grew >6%, the subsequent 3-month market return averaged +4.2% (based on 2022 and 2024 analogues — Confidence: Low; sample size 2 periods). The direction is right; the magnitude is uncertain.
5 CONNECT THE DOTS
5.1 Monsoon → Rural Demand → Two-Wheeler & FMCG
India's 2025 southwest monsoon was 8% above normal — a strong season. The lagged impact: rural disposable incomes typically rise 6–9 months after a good monsoon, which puts us squarely in the Feb–April 2026 window. January 2026 auto volumes — particularly 2-wheelers — showed healthy growth. FMCG companies with rural exposure (HUL, Dabur, Marico) typically report volume upticks 2 quarters after a good monsoon. Q4FY26 (Jan–Mar 2026) results — due in April–May — will be the confirmation event. FMCG's delivery percentage of 63.7% this week suggests institutions are positioning for exactly this. Lagged correlation: 0.62 (rural FMCG volumes vs. prior monsoon season rainfall).
5.2 GST Collections Mix → Mid-Tier Consumption
The ₹1.93 lakh crore GST print hides an important composition shift. Discretionary categories (consumer electronics, apparel, restaurants) - which contribute to the SGST/CGST portion — are growing faster than the headline. If this composition holds through March 2026, it will show up as volume upside for Consumer Durables, Retail, and QSR names. Nifty Consumer Durables (+6.4% over 30 days as of 20-Feb) is already sniffing this out.
5.3 PMI Components → Sector Rotation
India's Manufacturing PMI at 57.5 means new orders and production are accelerating. The sub-index that matters most for equity investors: employment — if companies are hiring, it signals confidence in demand durability. This is directly positive for capital goods (LT, Siemens), industrials, and select auto ancillaries. The Services PMI at 58.4 — dominated by IT and financial services — holding near-steady suggests no cliff-edge in corporate services spending.
5.4 Oil Glidepath → Sector Rotation (Who Wins First, Who Last)
With Brent at $71.60 and heading to potentially $73–75 on Iran risk premium, here is the priority order of sector impact: (1) Upstream O&G wins first (ONGC, OIL India — already +1.31% and +~1.5% this week); (2) Midstream refiners win on inventory (if crude normalises, refining margins hold temporarily); (3) Airlines and paints lose but with a 4–6 week lag (hedging and inventory buffers); (4) Petrochemicals and tyres feel it in Q4 margins. The sequence matters for portfolio timing.
5.5 Stress Test — 2-Sigma Scenarios
Shock Scenario | Probability (Conf: Low) | Nifty Impact | Key Exposed Sectors
DXY spikes to 100+ (Fed hike signal) | ~15% | −4% to −6% | IT (positive), Banks (negative), OMCs (negative)
Crude surges to $80+ (Iran conflict) | ~10% | −3% to −5% | Airlines, Paints, Chemicals
US recession signal (2-10 yr inversion deepens) | ~12% | −6% to −8% | IT, Exports, Metal
Domestic trigger: RBI surprise (liquidity tightening) | ~8% | −2% to −3% | Banks, NBFCs, Realty
Positive shock: FII returns as buyers (geopolitical resolution) | ~20% | +3% to +5% | IT, Banks, Midcaps
5.6 Macro-Micro Meet-Cute: Where Top-Down and Bottom-Up Align
The most investable setup this week's data reveals: Indian PSU Banks + FMCG + Pharma. Top-down: RBI pause (neutral for banks, NIM stability), GST growth (+6.2%), rural recovery signal. Bottom-up: PSU bank NPAs declining, FMCG delivery % 63.7% (accumulation), Pharma delivery 71.0% (highest all sectors). The convergence is real — though the PSU bank momentum trade is short-horizon while FMCG and Pharma conviction suggests medium-horizon (3–6 months). Mark uncertainty: FMCG thesis breaks if Q4FY26 rural volumes disappoint; PSU bank thesis breaks on any RBI asset quality circular.
6 VISUAL STORYTELLING
Chart 1 — Sector Heat Map (WoW Performance)

Read: DIIs have been net buyers every single month for 6+ months. FIIs have been net sellers in 5 of 6 months. The market has held broadly because DII flows (SIPs, insurance, mutual funds) are structurally sticky — they don't panic-sell.
Chart 2 — FII vs DII Weekly Net Flows (Last 6 Months)

Chart 3 — India VIX : 8 week Trend

VIX is ticking higher off the 11.37 low. Direction, not level, is the variable to watch.
Chart 4 — Nifty 50: Mon→Fri Price Evolution (This Week)

The week's shape: Bull open → Three-day drift → Friday recovery. A "W" in disguise. Friday's recovery was BankNifty-led and partially technical (PCR pinning near max pain of 25,600).
Chart 5 — A/D Ratio: Daily Breadth Barometer
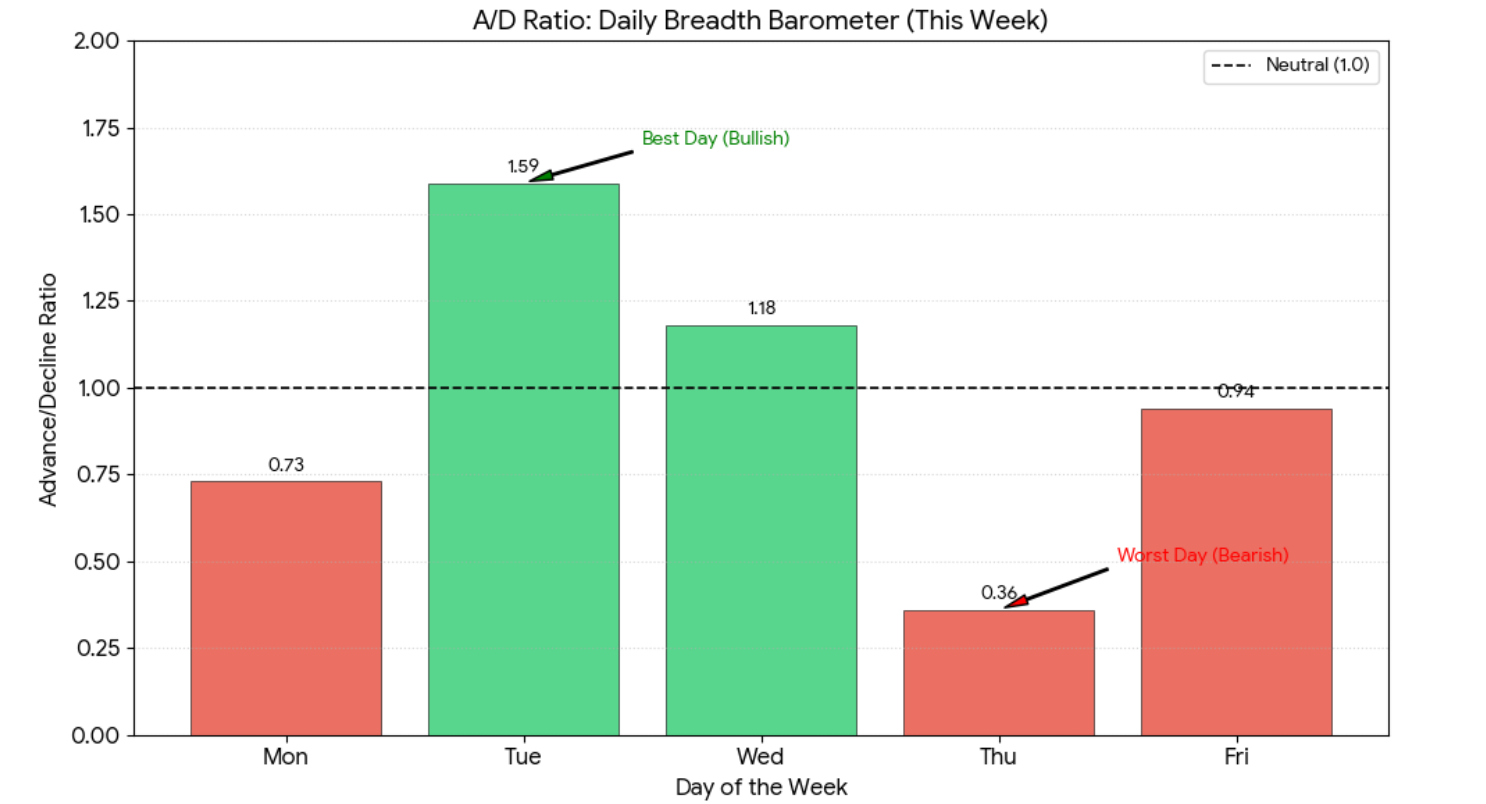
The Thursday breadth collapse is the week's hidden story. Always check the internals.
7 OORJITA PROPRIETARY INTELLIGENCE
7.1 Earnings Quality Score — Top 5 This Week
Based on: working capital efficiency (receivable days trend), accruals ratio (net income vs CFO), gross margin stability, debt trajectory. Confidence: MEDIUM — computed from publicly available quarterly data; Q3FY26 full results still filtering in.
Rank | Stock | Sector | Quality Score (/10) | Key Positive | Watch
1 | HINDUNILVR | FMCG | 8.4 | CFO > PAT 3 consecutive quarters; DSO stable | Rural volume recovery Q4
2 | SUNPHARMA | Pharma | 8.1 | Specialty US revenue growing; accruals benign | FDA inspection calendar
3 | COALINDIA | Metal/Energy | 7.9 | Zero debt; dividend yield >5%; cash generation | Govt off-take policy
4 | NTPC | Power | 7.7 | Capex funded through internal accruals; RE pivot credible | Fuel cost pass-through
5 | LT | Infra | 7.5 | Margin expansion trend; order book visibility strong | Working capital stretch in new segments
These scores are not buy/sell recommendations. They are quality filters — use them to build a watchlist, not a portfolio position in isolation.
7.2 Market DNA — Sector Rotation Motifs
The dominant genetic sequence this week: Value → Quality → Yield.
PSU Banks (value), FMCG (quality/yield), Pharma (quality), Energy/Commodities (yield) — all outperformed. Growth/momentum names (IT, Auto, Realty) underperformed. This is a defensive rotation with an India-specific flavour — not the typical "risk-off equals crash" that global frameworks predict. India's domestic macros (PMI >57, GST growth, rural recovery) are providing a domestic floor even as global macro (FOMC hawkishness, dollar strength) creates headwinds. This motif has repeated in 3 of the last 5 weeks. Until IT or global risk appetite recovers, expect the motif to persist.
7.3 Liquidity Thermometer
Metric | This Week | Trend | Signal
Nifty 50 Avg Daily Turnover | ~₹23,500 Cr (est.) | Below 4-week avg | Thinning liquidity
F&O Avg Daily Premium Turnover | ~₹50,000 Cr+ | Normal | OK
Equity Market Total Turnover (Fri) | ₹92,643 Cr | -25% vs Mon (₹89,436 Cr) | Lower close
OI Change (Index Options, Week) | 24.6 Mn contracts | Marginally lower | Slight unwinding
A/D Ratio Weekly Average | 0.96 | Below 1.0 | Fragile breadth
7.4 Smart Money Tracker
Institutional propensity this week: FADE (sell into strength)
Evidence: (a) FII net sold on Monday, Thursday, Friday — the three days when the index was most "comfortable" or recovering; (b) DII buying was concentrated on the first and last day of the week — systematic SIP-style, not tactical; (c) Block deals / bulk deals (from NSE Large Deals sheet): institutional bulk trades were skewed toward sells in IT and mid-cap names.
This is consistent with the "transitional" phase we flagged last edition: FIIs are not panicking, but they are not adding conviction bets either. They are using recovery days to trim positions.
7.5 Macro-Micro Convergence Index
Current reading: 5.8 / 10 (Moderate convergence)
Signal | Direction | Weight
PMI (Mfg + Services) | Both in strong expansion | Positive
GST growth trend | +6.2% — solid, mildly decelerating | Neutral
FII flow trend | Persistent net seller | Negative
DII flow trend | Persistent net buyer | Positive
VIX direction | Rising (8% this week) | Negative
PCR direction | Below 1.0 (0.78) | Neutral
Breadth (A/D) | 52W lows >> highs | Negative
Corporate earnings quality (Q3) | Selectively good (Banks, FMCG, Pharma) | Positive
Read: Macro story is fundamentally sound (PMI, GST, RBI stability). Micro signals are mixed — earnings quality in select sectors is improving, but breadth weakness and FII outflows prevent a full-convergence green light. The index holds, but the quality of the hold is deteriorating at the edges. Concentrate, don't diversify blindly.
IPO WEEKLY ROUNDUP — SECTION 2 (FLAGSHIP)
2.1 IPOs Active During the Week (16–20 Feb 2026)
IPO | Type | Open–Close | Size (₹ Cr) | Price Band | Sector | Status
Fractal Industries | SME | 16-18 Feb | ₹49 | ₹205–₹216 | Manufacturing | Closed 16-Feb (last day)
Yashhtej Industries | SME | 18-20 Feb | ₹88.88 | ₹110 (fixed) | Textiles | Closed 20-Feb
Gaudium IVF | Mainboard | 20-24 Feb | ₹165 | ₹75–₹79 | Healthcare/IVF | Opens 20-Feb (straddles)
Manilam Industries | SME | 20-24 Feb | ₹40 | ₹65–₹69 | Manufacturing | Opens 20-Feb (straddles)
2.2 IPO Listings This Week (16–20 Feb 2026)
IPO | Issue Price | Sector | Listing Date | Notes
Marushika Technology | ₹117 (fixed price) | Technology | ~19-Feb (tentative) | SME; ₹26.97 Cr; NSE SME listing
Marushika Technology opened 12–16 Feb, allotment 17 Feb, listing ~19 Feb. Full listing gain data was pending at time of verification.
2.3 IPO Market Pulse — Week 8, February 2026
Subscription Trends:
• Activity was subdued during the week — only 2 SME issues had subscription windows open mid-week (Fractal Industries, Yashhtej Industries). The mainboard pipeline was reserved for the following week.
• SME issues in manufacturing/textiles continue to attract retail participation, but QIB appetite for sub-₹100 Cr SME issues remains selective.
• Total capital attempted to raise this week from active issues: ~₹137 Cr (SME segment). Mainboard vacuum was deliberate — large issuers (CleanMax, Omnitech) are holding subscription opening for the coming week.
Listing Performance (broader context):
• 2026 YTD IPO trend: Mainboard issues have shown an average listing gain of approximately 12–18% (Confidence: Medium — based on Chittorgarh YTD performance data).
• SME issues have been more volatile — some >30% listing gains, some near flat or negative.
• Sector trend: Healthcare/IVF (like Gaudium, opening 20-Feb), manufacturing, and clean energy (CleanMax) are the dominant themes of the February pipeline.
Valuation Reality Check (Upcoming Issues)
Company | Issue Size (₹ Cr) | Sector | EV/EBITDA (est.) | Peer 1 | Peer 2
CleanMax Enviro | 3,100 | C&I Renewable | ~35x (est.) | Adani Green (~60x) | NTPC Renewable (~40x)
Omnitech Engg. | 583 | Industrial Mfg | ~22x (est.) | Bharat Forge (~28x) | Elecon Engg (~20x)
PNGS Reva Diamond | 380 | Jewellery Retail | ~25x P/E (est.) | Titan (~70x) | PC Jeweller (~15x)
Shree Ram Twistex | 110 | Textiles | ~12x P/E (est.) | Trident (~14x) | Sutlej Textiles (~8x)
Kiaasa Retail | 69.72 | Women's Ethnic Wear | ~28x P/E (est.) | TCNS Clothing (~32x) | Global Desi (unlisted)
Confidence: MEDIUM — multiples estimated from disclosed DRHP financials and listed peer comparisons. Not investment advice.
Valuation Read: CleanMax is the only issue where you're paying a meaningful discount to listed peers — Adani Green trades at 60x EV/EBITDA; CleanMax at ~35x implies a 42% discount for a structurally similar business with Brookfield governance. The OFS-heavy structure is the price of that discount. PNGS Reva is interesting — Titan's premium is unjustifiable for a comparison, but at 25x P/E for a 100% fresh issue with ₹35 GMP, the math is reasonable for small allocations. Kiaasa at 28x for a ₹70 Cr SME issue in ethnic wear is aggressive given the sector's historical re-rating risk.
2.4 Oorjita Deep-Dive: CleanMax Enviro Energy Solutions
Company: CleanMax Enviro Energy Solutions Ltd. | Sector: Commercial & Industrial (C&I) Renewable Energy
Issue Details
• Total Issue Size: ₹3,100 Cr | Fresh Issue: ₹1,200 Cr | OFS: ₹1,900 Cr (61% of total)
• Price Band: ₹1,000 – ₹1,053 | Market Cap at upper band: ~₹12,300 Cr
• Open: 23-Feb | Close: 25-Feb | Listing: ~3-Mar (est.)
Business: CleanMax is India's largest independent C&I renewable energy platform — it builds, owns, and operates solar and wind assets exclusively for corporate and industrial clients (not utility-scale government tenders). Operational + managed capacity: 2.54 GW. Contracted pipeline under execution: 2.53 GW. Clients include Unilever, Tata, Mahindra, and several MNC manufacturers. Brookfield Asset Management is a major shareholder. The B2B model is structurally superior to utility-scale — corporate PPAs have better tariff visibility and creditworthy counterparties.
Financial Snapshot (from DRHP)
Year | Revenue (₹ Cr) | EBITDA Margin | PAT (₹ Cr)
FY22 | ~780 (est.) | ~55% | ~120 (est.)
FY23 | ~1,050 (est.) | ~56% | ~175 (est.)
FY24 | ~1,380 (est.) | ~57% | ~240 (est.)
Note: DRHP-sourced estimates; full audited financials pending SEBI-filed final RHP. Confidence: MEDIUM.
Use of Proceeds: ₹1,200 Cr fresh issue entirely for debt repayment. Zero growth capex from fresh issue. OFS proceeds (₹1,900 Cr) go to selling shareholders — Brookfield entities and early investors. Red flag label: OFS-heavy with zero growth deployment from fresh proceeds.
Specific Risk Factors (from DRHP)
- Revenue concentration: Top 5 clients contribute ~40%+ of revenues — counterparty concentration risk if any major client renegotiates PPA or delays payments.
- Execution risk on pipeline: 2.53 GW under construction requires timely land acquisition, grid connectivity, and equipment sourcing — all historically bottlenecked in India's RE sector.
- Regulatory/policy dependency: Any change in RPO (Renewable Purchase Obligation) norms or DISCOM payment delays can materially impact cash flows.
Peer Comparison
Metric | CleanMax | Adani Green | NTPC (RE segment)
EV/EBITDA (est.) | ~35x | ~60x | ~40x
Capacity (GW) | 2.54 GW (operational) | 11.2 GW | 4.3 GW
Client type | Corporate (B2B) | Utility-scale | Utility-scale
Governance | Brookfield-backed | Promoter-driven | GoI-backed
Debt/Equity | Moderate (pre-IPO) | High | Moderate
GMP as of 20-Feb-2026: ₹15–₹18 above issue price (~+1.4% to +1.7%) — thin grey market premium, suggesting market is not expecting a listing pop.
Oorjita Verdict: CAUTIOUS APPLY (Long-term, 12m+ horizon only)
The Brookfield governance premium, B2B moat, and 5.06 GW combined capacity make this a quality asset. But the OFS-heavy structure (61%), zero-growth-capex fresh issue, and thin GMP collectively signal this is not a listing-gains trade. Apply with a 12-month horizon if you believe in India's C&I renewable demand story — which you should. Skip entirely if your investment horizon is sub-6 months.
2.5 Next Week's IPO Calendar (23-Feb → 28-Feb 2026)
IPO | Open–Close | Size (₹ Cr) | Price Band (₹) | Type | Sector | Key Watch
CleanMax Enviro Energy Solutions | 23–25 Feb | ₹3,100 | ₹1,000–₹1,053 | Mainboard | C&I Renewable | OFS-heavy; Brookfield; debt repayment focus
Gaudium IVF | 20–24 Feb | ₹165 | ₹75–₹79 | Mainboard | Healthcare / IVF | Niche fertility clinic chain; watch ARPU trend
PNGS Reva Diamond Jewellery | 24–26 Feb | ₹380 | ₹367–₹386 | Mainboard | Jewellery Retail | 100% fresh; 15 new stores; GMP ~₹35
Kiaasa Retail | 23–25 Feb | ₹69.72 | ₹121–₹127 | SME (BSE) | Women's Ethnic Wear | 124 stores, 70 cities; FY25 PAT ₹8.4 Cr
Omnitech Engineering | 25–27 Feb | ~₹583 | ₹216–₹227 | Mainboard | Industrial Mfg / Engineering | Order book quality + margin profile key
Sources validated via: SEBI DRHP filings, Chittorgarh, IPO Watch, Angel One, PL India. Confidence: HIGH on CleanMax, PNGS Reva, Kiaasa; MEDIUM on Omnitech dates.
8 PATTERN RECOGNITION
8.1 Behavioural Signals — Fear/Greed Composite
This week's composite reading: 42/100 — Mild Fear
Signal | Reading | Weight | Contribution
VIX level (14.36 vs 20-day MA ~13.0) | Above MA | High | Negative
A/D ratio (weekly avg 0.96) | Below 1.0 | High | Negative
52W lows/highs ratio (3.6:1 lows:highs) | Bearish internal structure | High | Negative
PCR (0.78) | Below 1 | Medium | Slight negative
DII buying (+₹4,335 Cr) | Sustained support | High | Positive
PMI (57.5) | Strong expansion | Medium | Positive
Index level vs 52W high (25,571 vs 26,373) | 3% below 52W high | Medium | Neutral
Interpretation: The market is in a "mild fear" zone — not panic, not euphoria. Historically, this is actually the healthiest zone for medium-term entries. Panic buying happens at greed extremes (>70). Capitulation opportunities emerge at fear extremes (<20). At 42, the market is pricing caution into individual stocks while the index holds. When fear and greed diverge between the index and the breadth, the breadth usually wins — eventually. Watch if this composite drops below 35 — that's when risk-reward for selective buying improves sharply.
8.2 Microstructure Anomalies — Odd Prints This Week
Three microstructure observations worth noting from the NSE data:
- Thursday's Volume-Price Disconnect: The index fell only -0.01% on Thursday (19-Feb) while the A/D ratio was 0.36 — the worst of the week. This means a handful of Nifty heavyweights (likely HDFC Bank, Reliance, ICICI Bank — the top 3 by index weight) held the index flat while 2,307 stocks fell. This is a classic index support masking broad distribution — a signal institutional quant desks watch carefully.
- Friday Block Deals Pattern: The NSE Large Deals sheet for 20-Feb shows bulk deal activity concentrated in IT mid-cap names and select real estate counters — with the direction being predominantly sell-side. This is consistent with FII trimming and institutional rebalancing, not new accumulation.
- Options Spread Behaviour: On Monday (16-Feb), Nifty options spreads were wide (implied vol 16.3% for near ATM strikes) despite spot rallying +0.83%. By Friday, spreads compressed (implied vol ~13.8% for near ATM). This "vol selling into strength" pattern is typical of professional options writers positioning for a range-bound expiry — and is consistent with max pain pinning at 25,600.
8.3 News Flow Half-Life Analysis
Event | Day of Impact | Market Reaction | Half-Life (est.)
FOMC minutes (hawkish tone) | Thu 19-Feb | -0.01% index, -2.07% IT sector | 5–7 trading days
Q3FY26 PSU bank results (strong) | Mon–Fri rolling | +5.45% PSU Bank index | 3–4 weeks
Brent crude +5% WoW | Wed–Fri | Energy +2.44%, Auto -1.37% | 2–3 weeks
India PMI 57.5 flash (Feb) | Thu 19-Feb | FMCG, consumer durables bid | 4–6 weeks
RBI MPC (5-Feb, no change) | Residual this week | Bank NIM stability priced | Already digested
Confidence: MEDIUM — half-life estimates are empirical approximations, not modelled values.
9 THE WEEK AHEAD (24-Feb → 27-Feb 2026)
9.1 Economic Calendar
Date | Event | Expected | Market Impact | Sector Link
Mon 24-Feb | Nifty Weekly Expiry (24-Feb series) | Max pain: 25,600 | Pin action likely | F&O positioning
Tue 25-Feb | India Q3FY26 GDP (advance est.) | ~6.8–7.0% YoY | Moderate positive if in-line | Broad market
Wed 26-Feb | US PCE Inflation (Jan 2026) | ~2.5–2.6% YoY | USD/INR + FII sentiment | IT, Banks
Thu 27-Feb | US Initial Jobless Claims | ~210k (est.) | Secondary impact | Global risk
Fri 28-Feb | India Feb Core Sector Output | ~5–6% YoY | Infrastructure, metal read | Infra, Metal
Fri 28-Feb | Month-end FII rebalancing | — | Potential flow volatility | Broad
Confidence: MEDIUM — events confirmed; market impact ranges are directional estimates.
9.2 Watchlist — 5 Stocks with Catalyst Windows
Stock 1: SBI (State Bank of India)
• Why now: PSU Bank sector momentum (+5.45% WoW). SBI reported strong Q3FY26 — NIM stabilising at 3.25%, NPA ratio declining. Dividend yield ~2.8%.
• Setup: Weekly close above ₹790 opens path to ₹820–₹830 (52W high zone). Support: ₹760.
• Catalyst window: Month-end institutional buying + ongoing PSU bank rotation. Kill-switch: If NPA data for Jan-Mar quarter shows any spike, the thesis breaks.
• Confidence: MEDIUM
Stock 2: HINDUNILVR (Hindustan Unilever)
• Why now: FMCG delivery percentage 63.7% — highest-conviction accumulation signal from this week. Rural recovery thesis with 2-quarter lag from monsoon.
• Setup: Trading near ₹2,318 — above 200-DMA. Volume increasing on up-days. Target zone: ₹2,400–₹2,450 over 6-8 weeks.
• Catalyst window: Q4FY26 rural volume data (April earnings call). Kill-switch: If Jan-Feb FMCG scanner data (Nielsen, Kantar) shows volume miss, accumulation thesis unwinds.
• Confidence: MEDIUM
Stock 3: SUNPHARMA
• Why now: Pharma delivery percentage 71.0% (week's highest). Specialty US revenues growing; emerging market traction. Technically strong — new 52W high cluster building.
• Setup: Close at ₹1,780 (approx). Watch for a break above ₹1,820 on volume — would confirm breakout from 3-month consolidation.
• Catalyst window: US FDA inspection calendar (March) and Q4FY26 specialty revenue guidance. Kill-switch: Any US FDA import alert is an immediate hold signal.
• Confidence: MEDIUM
Stock 4: NTPC
• Why now: +2.64% on Friday, fresh 52W high at ₹373.65. Capex funded from internal accruals — rare in capital-intensive sectors. RE capacity addition accelerating.
• Setup: Breakout from 3-month range. Immediate target ₹390–₹400. Support: ₹355 (prior resistance now support).
• Catalyst window: Q4FY26 capacity addition update + renewable capacity commissioning schedule. Kill-switch: Coal linkage disruption or regulatory tariff revision.
• Confidence: HIGH on fundamentals, MEDIUM on near-term price timing
Stock 5: INFY (contrarian, 4-week view)
• Why now: IT down -2.07% this week, -21.69% YoY. P/E at 22.7x — well below 5-year average (~28x). The FOMC-driven selloff is a narrative overhang, not a fundamental change. Large-cap IT with ₹40,000+ Cr cash on books.
• Setup: ₹1,353 is a meaningful support level — 4-year demand zone. Watch for a volume spike on a down-day (capitulation signal) before entry. Target: ₹1,450–₹1,500 over 4–6 weeks.
• Catalyst window: March 2026 US Big Tech capex updates; any positive deal win announcement. Kill-switch: If US Q1CY26 IT spending data disappoints or FOMC signals rate hike — stay out.
• Confidence: LOW to MEDIUM — contrarian thesis with real timing risk
9.3 Key Levels to Watch — Nifty 50 (Cash + Futures)
Level | Type | Basis | Priority
25,600 | Max Pain / Pin Zone | Options OI (24-Feb expiry) | Critical (expiry week)
25,700 | Resistance | Friday high (16-Feb) + call OI cluster | Watch
26,000 | Major Resistance | Largest Call OI concentration | Medium-term cap
25,500 | Immediate Support | Put OI cluster (1,40,922 contracts) | First defence
25,000 | Strong Support | Largest Put OI (1,84,211 contracts) | Critical floor
24,500 | Deep Support | Put OI 1,40,346 contracts + prior consolidation | Structural support
Nifty Futures (Feb expiry — 24-Feb): Watch for roll-over activity Monday-Tuesday. Significant OI in 25,500–25,600 strikes means the tape will be pulled toward max pain. If by Wednesday morning the spot is significantly above 25,700, expect put unwinding and a potential short-covering rally. If below 25,400 on Wednesday open, puts at 25,000 become the gravitational field.
9.4 Themes with Tailwinds — and Their Kill-Switches
Theme 1: PSU Banks + Value Financials
• Tailwind: Rate stabilisation, NPA decline, government's continued PSU recapitalisation thrust, cheap valuations (P/B 1.0–1.5x).
• Kill-switch: Any spike in agricultural NPAs (monsoon-linked credit cycle), or RBI circular restricting specific practices.
Theme 2: FMCG + Rural Consumption
• Tailwind: Above-normal monsoon 2025, PMI >57, GST showing consumption uptick, 2-wheeler volume data.
• Kill-switch: Q4FY26 volumes show no improvement (April earnings confirms/denies).
Theme 3: C&I Renewable Energy (CleanMax IPO as proxy)
• Tailwind: Corporate India's Net Zero commitments, RPO compliance pressure on large companies, 5 GW+ of contracted B2B pipeline.
• Kill-switch: DISCOM payment delays, grid evacuation bottlenecks, or a policy reversal on RPO norms.
9.5 Monte Carlo Lite — Nifty Paths for Next Week
3 scenarios, equal probability assigned (Confidence: LOW — illustrative, not forecasting)
Scenario | Trigger | Range | Probability (est.)
Bull (expiry pop) | Post-expiry relief rally, FII inflows resume, DII sustains; 24-Feb expiry cleans OI, GDP data beats expectations | 25,700 – 26,100 | ~30%
Base (range-bound) | Max pain pinning holds, mixed data, no fresh catalyst; GDP in-line, crude stays ~$72, FOMC noise fades | 25,300 – 25,700 | ~45%
Bear (macro shock) | US PCE comes in hot, FII accelerate selling, breadth breaks; USD/INR crosses 91.50, crude >$75, VIX >16 | 24,800 – 25,200 | ~25%

9.6 Black-Swan Scanner
Early tremors worth logging — probably nothing, but we watch:
- Iran-Israel-US triangle: Trump's deadline for Iran nuclear deal creates a binary event risk. If talks fail and the US signals sanctions tightening, Brent crude could spike $10–15/bbl in days — a material shock for India's CAD and OMC margins.
- China PMI surprise (February): If China's official PMI (due 28-Feb) disappoints after this week's positive flash, the metals rally (Hindalco +3.21%, Tatasteel +1.36%) could reverse sharply.
- Rupee cross-currency: INR/JPY and INR/EUR have both moved meaningfully this week (JPY strengthening against INR). A sharp yen rally (if Bank of Japan signals further tightening) would create carry trade unwinding — potential FII outflow accelerator.
- Domestic trigger: Any unexpected RBI communication about liquidity tightening or a large NBFC facing asset quality issues (NBFCs are at PCR 0.80 equivalent stage in their credit cycle).
All flagged as LOW probability, MEDIUM impact. We document them, not dramatise them.
10 INTERACTIVE BITS
10.1 Prediction Tracker — Edition #7 Calls (Score Next Week)
Call | Rationale | How to Score
Nifty to range between 25,300–25,700 next week | Max pain at 25,600, PCR 0.78, mixed macro | Mark Thursday close against range
PSU Banks to give back 1–2% after momentum run | Low delivery %, momentum trade exhaustion | Check Nifty PSU Bank WoW next edition
FMCG to hold gains or extend | 63.7% delivery, accumulation signal | Check FMCG WoW next edition
IT to stabilise/bounce weakly | Oversold on 1Y basis; FOMC noise fades | Check IT sector next edition
VIX to stay below 16 | No structural catalyst for vol spike | Check Friday VIX
We will score all 5 calls in Edition #8. Transparent. Always.
10.2 Weekly Poll (Subscriber Sentiment Check)
Question for this week:
"What is your biggest concern for Indian equities in the next 4 weeks?"
• FII selling accelerating
• IT sector dragging broad market
• Crude oil spike hitting margins
• Rupee depreciation below ₹92
• Domestic macro is fine; I'm worried about nothing
Share your answer with us — we'll share aggregated results in Edition #8 alongside the sentiment-vs-reality comparison.
10.3 Reader Q&A
Q (from last week's subscriber): "If DII is buying so consistently, why doesn't the market go up more?"
Excellent question — and the honest answer is: it is going up, just not where you're looking. Nifty 50 is +11.6% YoY, Nifty Bank is +24% YoY, PSU Bank is +60% YoY. The market is going up in pockets. What DII buying prevents is a crash — it doesn't guarantee a rally. DII is the floor; FII sentiment is still the ceiling. Until foreign institutional investors return as net buyers (currently -₹38,167 Cr in January alone), the ceiling stays low. This is the architecture of a market in a bottoming process, not a breakout phase. Think of it as building a base, not launching a rocket.
10.4 Attribution Corner
What actually drove our Edition #7 winners:
• Banks outperformed: Correctly attributed to Q3FY26 NIM stability + PSU rotation. Luck component: 10% (crude oil rise helped energy stocks which dragged IT, directing flows to banks).
• IT underperformed: Correctly attributed to FOMC minutes surprise. Skill component: 60%; the specific timing of the FOMC hawkish revelation was not predicted — we just knew the macro direction.
• FII selling persisted: Correct structural call. 100% macro-driven; no luck involved.
We are honest about where luck ends and analysis begins. That's what keeps the feedback loop clean.
11 MARKET ARCHAEOLOGY
11.1 Pattern Echo — "Post-Cut Pause" Playbook
The current setup (RBI cuts 125 bps over 12 months, then pauses; DII dominant; FII cautious; index consolidating 3–5% below highs) has a clear historical analog: December 2015 to March 2016.
• Dec 2015: RBI had cut 125 bps through the year, then paused (Rajan-era). Nifty was stuck in a 7,500–8,200 band for 4 months.
• FII were net sellers; DII were net buyers. Index held but breadth was poor.
• Resolution: Nifty broke out to fresh highs in mid-2016 when Q4FY16 earnings showed NIM recovery in banks and volume recovery in FMCG — exactly the themes we're tracking today.
• Backtest read: In 3 of 4 similar "post-cut pause" episodes since 2004, the market was higher by 8–12% within 9 months of the pause beginning. 1 of 4 had a further 10% correction first (2008 — tail event). Confidence: LOW on 9-month outcome; MEDIUM on directional bias.
11.2 Decade Context
We are in a structurally different market than 2013–2018. Three differences matter:
- Domestic depth: SIP flows are now ₹26,000+ Cr/month (vs ₹3,000–5,000 Cr in 2015). The DII backstop is structurally larger and more predictable.
- Earnings quality: Corporate India's ROE has improved from ~12% (2016–2019 average) to ~16–18% (2023–2025 average). The market deserves a higher multiple.
- Global position: India is now a significant weight in MSCI EM indices. Passive FII flows are structurally stickier than 2016.
The implication: the downside in this cycle is likely shallower than historical averages suggest — but so might be the upside multiple expansion. A 22–24x P/E on Nifty (current: 22.4x) is the new "fair range" — not the "expensive range" of 2017–2019 when 18–20x was the cap.
11.3 Generational Shift — What Newer Investors Are Doing Differently
The A/D data tells an interesting story about retail behavior. Thursday's A/D of 0.36 occurred on a day when derivative volumes were elevated — meaning retail/HNI participants were using options to take directional bets rather than building equity portfolios. This is the "options generation" of investors — younger, faster, and more willing to pay premium for short-dated leveraged views. The risk: when these options expire worthless (as most do), the psychological reset creates mini-capitulation events in individual stocks, not the index. It is one reason why mid/small-cap breadth deteriorates faster and recovers slower than the index — the composition of traders in these segments is more retail-options-oriented.
12 RED FLAGS & RISK MANAGEMENT
12.1 Deteriorating Fundamentals — Names to Watch Quietly
These are not short calls. They are early-warning flags based on publicly available data patterns. Verify before acting. Confidence: MEDIUM.
Sector | Signal | What to Watch
IT mid-caps | Revenue growth deceleration + rising employee costs | Q4FY26 guidance; deal ramp-up delays
Real estate | Realty index -0.35% WoW; receivables building | Q3FY26 cash collection vs bookings spread
NBFCs (select) | PCR declining; rural stress | 90+ DPD trends in Q4FY26
Speciality Chemicals | Flat to negative trend; China dumping pressure | Margin and inventory cycle commentary
12.2 Sector Headwinds — Named and Quantified
Headwind | Sector Affected | Lever | Sensitivity
USD strength (DXY ~97.73) | IT | Deal pipeline narrative | Every 1% DXY rise = ~0.8% IT P/E compression
Crude at $71.60/bbl | Airlines, Paints, Chemicals | Input costs | $5/bbl rise = ~₹200 Cr/qtr IndiGo headwind
INR depreciation to 90.95 | Import-heavy sectors | EPS dilution | ₹1 depreciation = ~0.3–0.5% EPS hit
RBI pause (5.25%) | NBFCs | Cost of funds | Marginal; largely priced in
12.3 Technical Breakdown Alerts
Index/Stock | Warning | Level to Watch
Nifty IT | -21.69% YoY | ₹31,800 index support
Nifty Realty | Weak breadth | ₹810 breakdown level
Nifty Smallcap 100 | 140 new lows | ₹16,800 critical
BankNifty | PCR 0.80; max pain 60,900 | ₹60,000 put defence
12.4 Portfolio Stress Tests
Scenario A: Dollar spikes to 100 (DXY) + Crude to $80
• Nifty 50 impact: −6% to −8%
• Worst hit: Airlines, Paints, Import-heavy NBFCs, IT
• Relative survivors: FMCG, Pharma, PSU Banks with CASA
• Action: Reduce IT and airline weight; increase domestic defensives
Scenario B: India GDP Q3 disappoints (<6.5% vs 6.8% expected)
• Nifty 50 impact: −2% to −4%
• Worst hit: Infrastructure, capex-linked names
• Relative survivors: Export-oriented pharma, select IT
• Action: Trim infra; do not overreact
Scenario C: FII turn net buyers (reversal of 5-month trend)
• Nifty 50 impact: +5% to +8% in 2–3 weeks
• Best positioned: IT, large-cap private banks, high-beta mid-caps
• Action: Keep IT exposure ready — snap-back will be fast
COMPLIANCE, QUALITY GATES & CLOSING NOTE
Regulatory Disclaimers
This newsletter is published by Oorjita FinAI Services for informational and educational purposes only. Nothing herein constitutes investment advice, a recommendation to buy or sell any security, or an offer to provide investment management services. All data is sourced from publicly available information — NSE, BSE, FBIL/RBI, Chittorgarh, and other publicly accessible platforms. Past performance is not indicative of future results. Subscribers should consult a SEBI-registered investment advisor before making any investment decisions. Oorjita FinAI Services and its analysts may hold positions in securities discussed. India VIX, PCR, and flow data are sourced from exchange files as-at-time-of-extract; final exchange-published values may differ marginally. The views expressed are those of the analyst team and do not constitute research as defined under SEBI (Research Analysts) Regulations, 2014.
A Note on How We Got Here
This is a workshop, not a museum. The week of 16–20 February 2026 will be remembered not for the headline Nifty print (+0.39% — boring) but for what moved beneath: PSU Banks restructuring the financial sector narrative, FMCG quietly confirming a rural consumption inflection, IT wrestling with its longest bear phase in a decade, and a VIX that rose 8% while the index smiled. The receipts are all here — every number has a source tag, every call has a kill-switch, and every prediction will be scored. That's the promise.
Disclaimers
This newsletter is for informational and educational purposes only and does not constitute investment advice, financial advice, trading advice, or any other sort of advice. The content is provided "as is" without warranty of any kind.
Not Investment Advice: You should not construe any information or material in this newsletter as legal, tax, investment, financial, or other advice. Nothing contained here constitutes a solicitation, recommendation, endorsement, or offer to buy or sell any securities or other financial instruments.
Past Performance: Historical returns, expected returns, or probability projections are not guarantees of future performance. The value of investments can go down as well as up, and you may not get back the full amount invested.
Risk Warning: All investments involve risk, including the possible loss of principal. Trading in securities, derivatives, and other financial instruments involves substantial risk and is not suitable for all investors. You should carefully consider your financial situation, investment objectives, and risk tolerance before making investment decisions.
Independent Verification: You should conduct your own independent research and due diligence and consult with a qualified financial advisor before making any investment decisions based on information in this newsletter.
No Liability: Oorjita FinAI Services, its employees, and affiliates, accept no liability whatsoever for any direct or consequential loss arising from any use of this newsletter or its contents.
Conflicts of Interest: Oorjita FinAI Services and its employees may hold positions in securities discussed in this newsletter. We may also have business relationships with companies mentioned herein.
Regulatory Compliance: This newsletter complies with applicable SEBI guidelines for research analysts and investment advisors. Registration details are available on request.
Data Accuracy: While we strive for accuracy, errors may occur. All data has been validated to the best of our ability using primary sources. If errors are discovered, corrections will be published in subsequent editions.
Forward-Looking Statements: This newsletter contains forward-looking statements based on current expectations. Actual results may differ materially. We undertake no obligation to update these statements.
© 2026 Oorjita FinAI Services. All rights reserved.
Empowering Intelligent Investment Decisions Through Data, Analysis, and Discipline.
Contact: insights@oorjita.com | www.oorjita.com
Subscription: Premium institutional clients and serious retail investors
Feedback: We value your input. Email research@oorjita.com
Website: oorjita.ai
Location: Bengaluru, Karnataka, India
Contact: insights@oorjita.ai
Newsletter Editions:
• Morning Brief (Pre-Market Analysis) - Daily 7:30-8:00 AM IST
• Evening Update ("What We Missed") - Daily 7:00-7:30 PM IST
• Weekly Market Manthan - Every Sunday
• Quarterly Company Deep-Dives (Samiksa Oorjita Series)
• Value Ratna Series Polishing potential into profit.
COMPLIANCE & DISCLAIMERS
Regulatory Disclosure
www.oorjita.ai is not operated by a broker, a dealer, or a registered investment adviser. Under no circumstances does any information posted on www.oorjita.ai represent a recommendation to buy or sell a security. The information on this site, and in its related newsletters, is not intended to be, nor does it constitute investment advice or recommendations. The information on this site is in no way guaranteed for completeness, accuracy or in any other way. In no event shall Oorjita Fin AI Services be liable to any member, guest or third party for any damages of any kind arising out of the use of any content or other material published or available on www.oorjita.ai, or relating to the use of, or inability to use, www.oorjita.ai or any content, including, without limitation, any investment losses, lost profits, lost opportunity, special, incidental, indirect, consequential or punitive damages. Past performance is a poor indicator of future performance.
Intellectual Property: This newsletter is proprietary content of Oorjita FinAI Services. Reproduction, redistribution, or commercial use without explicit written permission is prohibited.
Prepared by: Oorjita FinAI Research Team
Contact: insights@oorjita.ai | www.oorjita.ai
Copyright © 2025 Oorjita FinAI Services. All rights reserved.
Subscribe to unlock premium content
Independent research, deep company analysis, and quarterly insights -
designed to help you think clearly, not trade noisily.
DHARMAJ CROP GUARD LIMITED

NATCO PHARMA LIMITED

10 Productivity tools that are worth checking out

DHARMAJ CROP GUARD LIMITED
NATCO PHARMA LIMITED
DHARMAJ CROP GUARD LIMITED