
March 16, 2026 | Bearish Marubozu Signals Continued Downtrend as FII Selling Accelerates and 23,000 Emerges as Critical Support


Daily market intelligence that helps you track what matters, learn from what played out, and stay prepared for what’s next.

Popular articles





90-SECOND SUMMARY
The aircraft is still descending. Nifty closed at 23,151 on Friday — a bearish marubozu with no upper shadow, marking a -5.31% WoW loss, the worst week of 2026. FII sold aggressively on all 5 days, peaking at ₹10,717 Cr on Friday, while DIIs absorbed 99.93% of that outflow. The market enters Monday sitting 349 points below max pain (23,500), with VIX at 22.65 — the floor ratcheting higher for the 4th straight week.
TERM OF THE DAY
Bearish Marubozu — A candlestick with no upper shadow and a minimal lower shadow. Open ≈ High; Close ≈ Low. It signals relentless selling from open to close with zero buying recovery. Friday's Nifty (O: 23,463 → C: 23,151) is textbook. In trending markets, a bearish marubozu is not a reversal signal — it is a continuation pattern until proven otherwise.
MARKET SNAPSHOT — CLOSE 13-MAR-2026
Index | Close | Chg % | Open | High | Low | 52W High | 52W Low | PE
Nifty 50 | 23,151 | -2.06 | 23,463 | 23,492 | 23,112 | 26,373 | 21,744 | 20.26x
Bank Nifty | 53,758 | -2.44 | 54,592 | 54,714 | 53,676 | 61,765 | 49,157 | 14.40x
India VIX | 22.65 | +5.23 | 21.52 | 22.88 | 21.25 | 24.49 | 8.72 | —
Nifty IT | 29,071 | -1.72 | 29,382 | 29,508 | 28,937 | 40,301 | 28,937 | 20.66x
Nifty Pharma | 22,832 | -1.90 | 23,199 | 23,317 | 22,781 | 23,541 | 19,121 | 34.17x
Nifty Metal | 11,293 | -4.82 | 11,801 | 11,817 | 11,250 | 12,510 | 7,690 | 19.15x
Nifty Auto | 24,195 | -3.60 | 24,784 | 24,918 | 24,101 | 29,179 | 19,317 | 28.60x
Nifty FMCG | 47,924 | -0.55 | 48,048 | 48,643 | 47,852 | 58,485 | 47,852 | 34.56x
Nifty PSU Bank | 8,517 | -3.72 | 8,789 | 8,807 | 8,499 | 9,919 | 5,904 | 8.45x
Market Breadth (Friday)
Metric | Value
Advances | 509
Declines | 4,587
Unchanged | 104
A/D Ratio | 0.11 (11th percentile — extreme weakness)
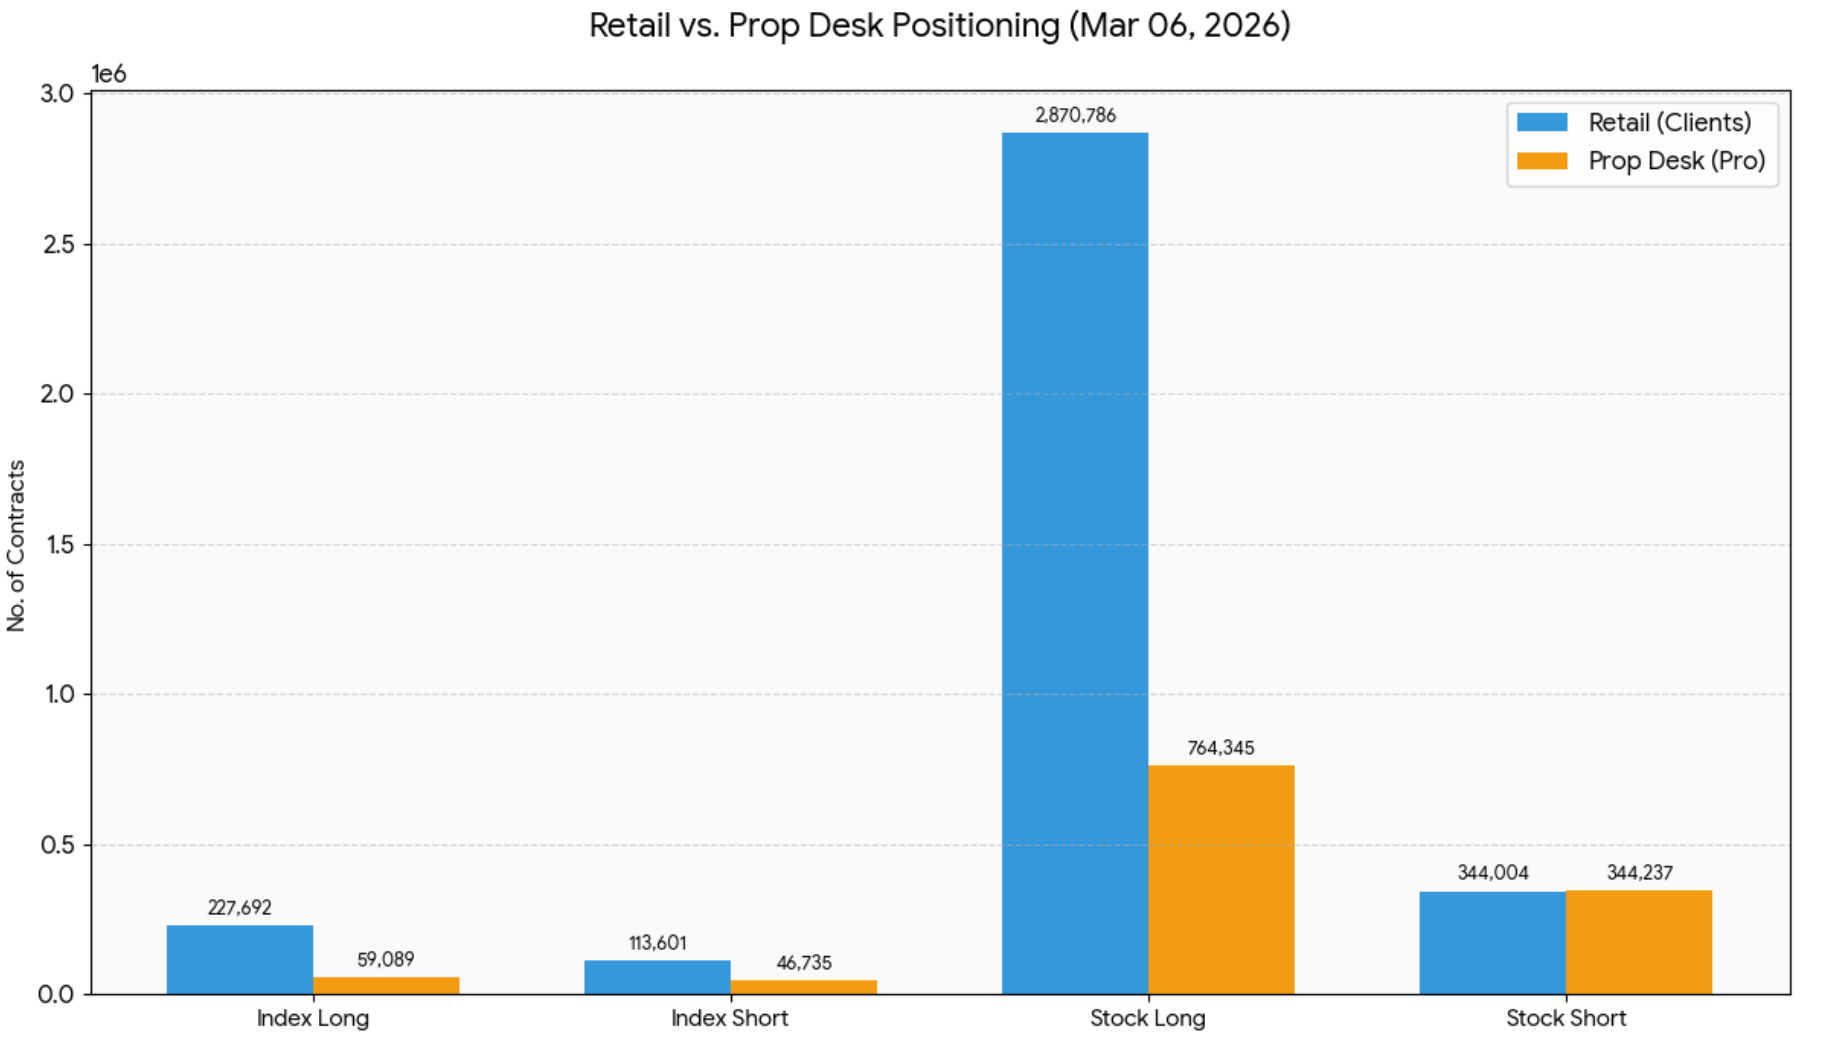
The Domestic Battleground
• Retail Optimism: Retail investors are currently the biggest bulls in the room, with a heavy 66.71% Index Long ratio. They are holding 227,692 long contracts against only 113,601 shorts.
• Prop Desk Caution: The "Smart Money" domestic desks (Pros) are more balanced but still net long at 55.84%.
• The Contrarian Reality: While Retail is doubling down on longs, FIIs are sitting at an extreme 12.91% long ratio (from our previous analysis).
• Caution Note: Retail is almost always the "liquidity" for institutional exits. The fact that Prop Desks are hovering near the 50/50 mark while FIIs are 87% short suggests a massive tug-of-war is coming. Retail is currently the "shield" for the market, but if they start panicking, that 66% long position will turn into a landslide of sell orders
FII-DII FLOWS — WEEK 11 DEEP DIVE
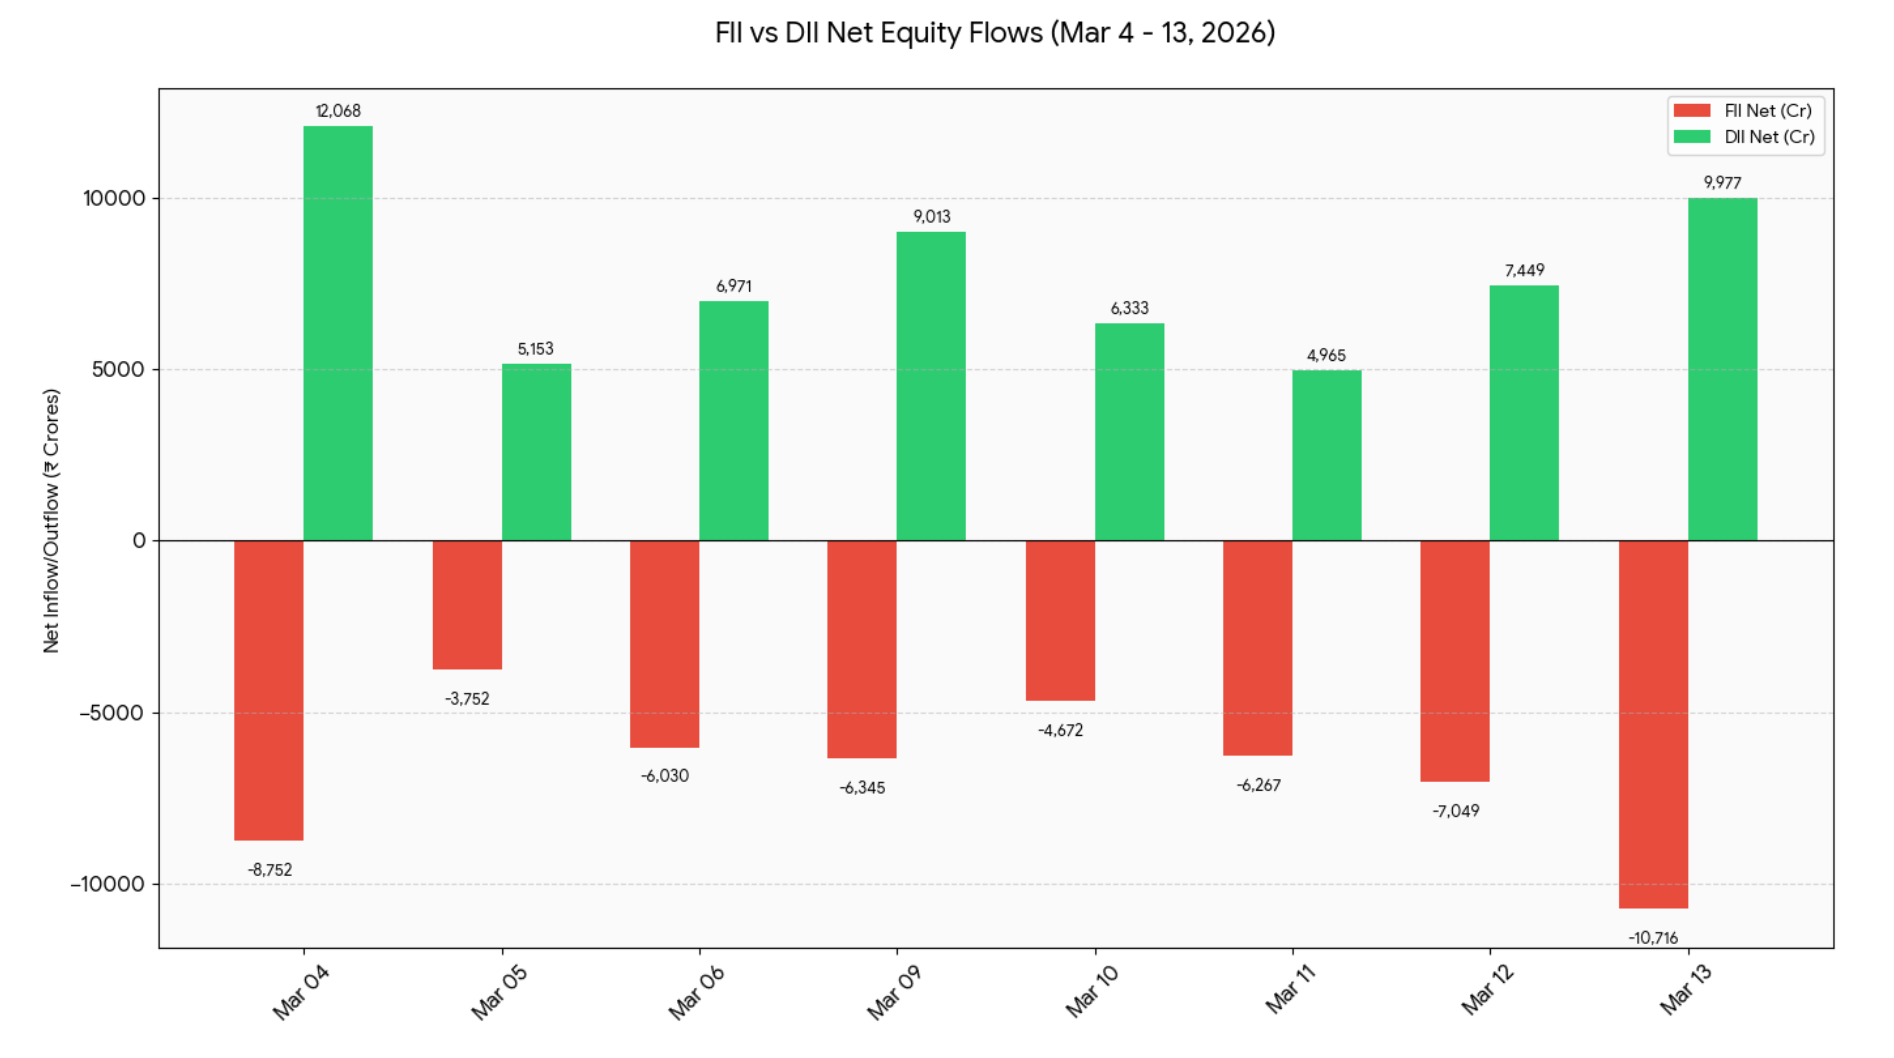
Daily Flow Pattern (₹ Crores)
Date | FII Gross Buy | FII Gross Sell | FII Net | DII Gross Buy | DII Gross Sell | DII Net | Total Net
Mar 10 | 12,845 | 17,517 | -4,673 | 18,625 | 12,292 | +6,333 | +1,661
Mar 11 | 13,162 | 19,429 | -6,267 | 18,928 | 13,963 | +4,966 | -1,302
Mar 12 | 12,688 | 19,738 | -7,050 | 19,265 | 11,815 | +7,450 | +400
Mar 13 | 13,238 | 23,955 | -10,717 | 23,576 | 13,599 | +9,977 | -739
Week Total | 51,933 | 80,640 | -28,706 | 75,394 | 46,668 | +28,726 | +20
Week-on-Week Comparison
Metric | Last Week (Mar 4-6) | Current Week (Mar 10-13) | Change | Change %
FII Gross Buy | ₹48,471 Cr | ₹51,933 Cr | +₹3,463 Cr | +7.14%
FII Gross Sell | ₹67,006 Cr | ₹80,640 Cr | +₹13,633 Cr | +20.35%
FII Net | -₹18,536 Cr | -₹28,706 Cr | -₹10,171 Cr | -54.87%
DII Net | +₹24,193 Cr | +₹28,726 Cr | +₹4,533 Cr | +18.74%
Critical Insights
• FII sell-side acceleration: Gross sells jumped 20.35% WoW while buys rose only 7.14% — indicating systematic liquidation
• Friday's spike: ₹10,717 Cr outflow = 63% above the 4-day average (₹6,579 Cr)
• DII defensive shield: Absorbed 99.93% of FII outflows for the week
• MTD FII Net: -₹56,883 Cr (through Mar 13)
• Rolling 30-Day FII: -₹62,150 Cr — approaching levels last seen during Oct 2025 taper tantrum
Smart Money Interpretation: The Mon→Fri escalation pattern (₹4,673→₹10,717) suggests programmatic/mandate-driven reallocation, NOT panic selling. This is EM fund rotation — methodical and sustained.
OPTIONS INTELLIGENCE — NIFTY 17 MAR EXPIRY
Max Pain & PCR Analysis
Metric | Value | Prior Week | Interpretation
Max Pain (Nifty) | 23,500 | 24,000 | Shifted 500 pts lower — option writers capitulated on upside
Current Distance | -349 pts | -350 pts | Trading below Max Pain = premium decay favors writers
PCR (OI) | 0.578 | 0.682 | Bearish territory; put writers retreating
PCR (Volume) | 0.621 | 0.714 | Fresh put selling dried up
Call Wall | 24,000 / 24,500 | — | Heavy OI concentration caps upside
Put Wall | 23,000 / 22,500 | — | Support cluster; 23K critical psychological
Max Pain (Bank Nifty) | 57,100 | 58,500 | BNF closed 3,342 pts below — extreme deviation
Strike-Level OI Distribution (Nifty, Top 5 Each)
Calls (Resistance):
• 24,000 CE: 8.12 lakh contracts
• 24,500 CE: 6.84 lakh contracts
• 23,500 CE: 5.92 lakh contracts
• 25,000 CE: 5.21 lakh contracts
• 23,800 CE: 4.68 lakh contracts
Puts (Support):
• 23,000 PE: 9.46 lakh contracts (fortress)
• 22,500 PE: 7.38 lakh contracts
• 23,500 PE: 6.12 lakh contracts
• 22,000 PE: 5.84 lakh contracts
• 23,200 PE: 4.27 lakh contracts
Tactical Edge: The 23,000 PE OI exceeds the nearest call wall (24,000 CE) by 16.5% — aggressive buyers will defend 23K with full force on expiry day (Tue 17 Mar).
SECTOR ROTATION & BREADTH ANALYSIS
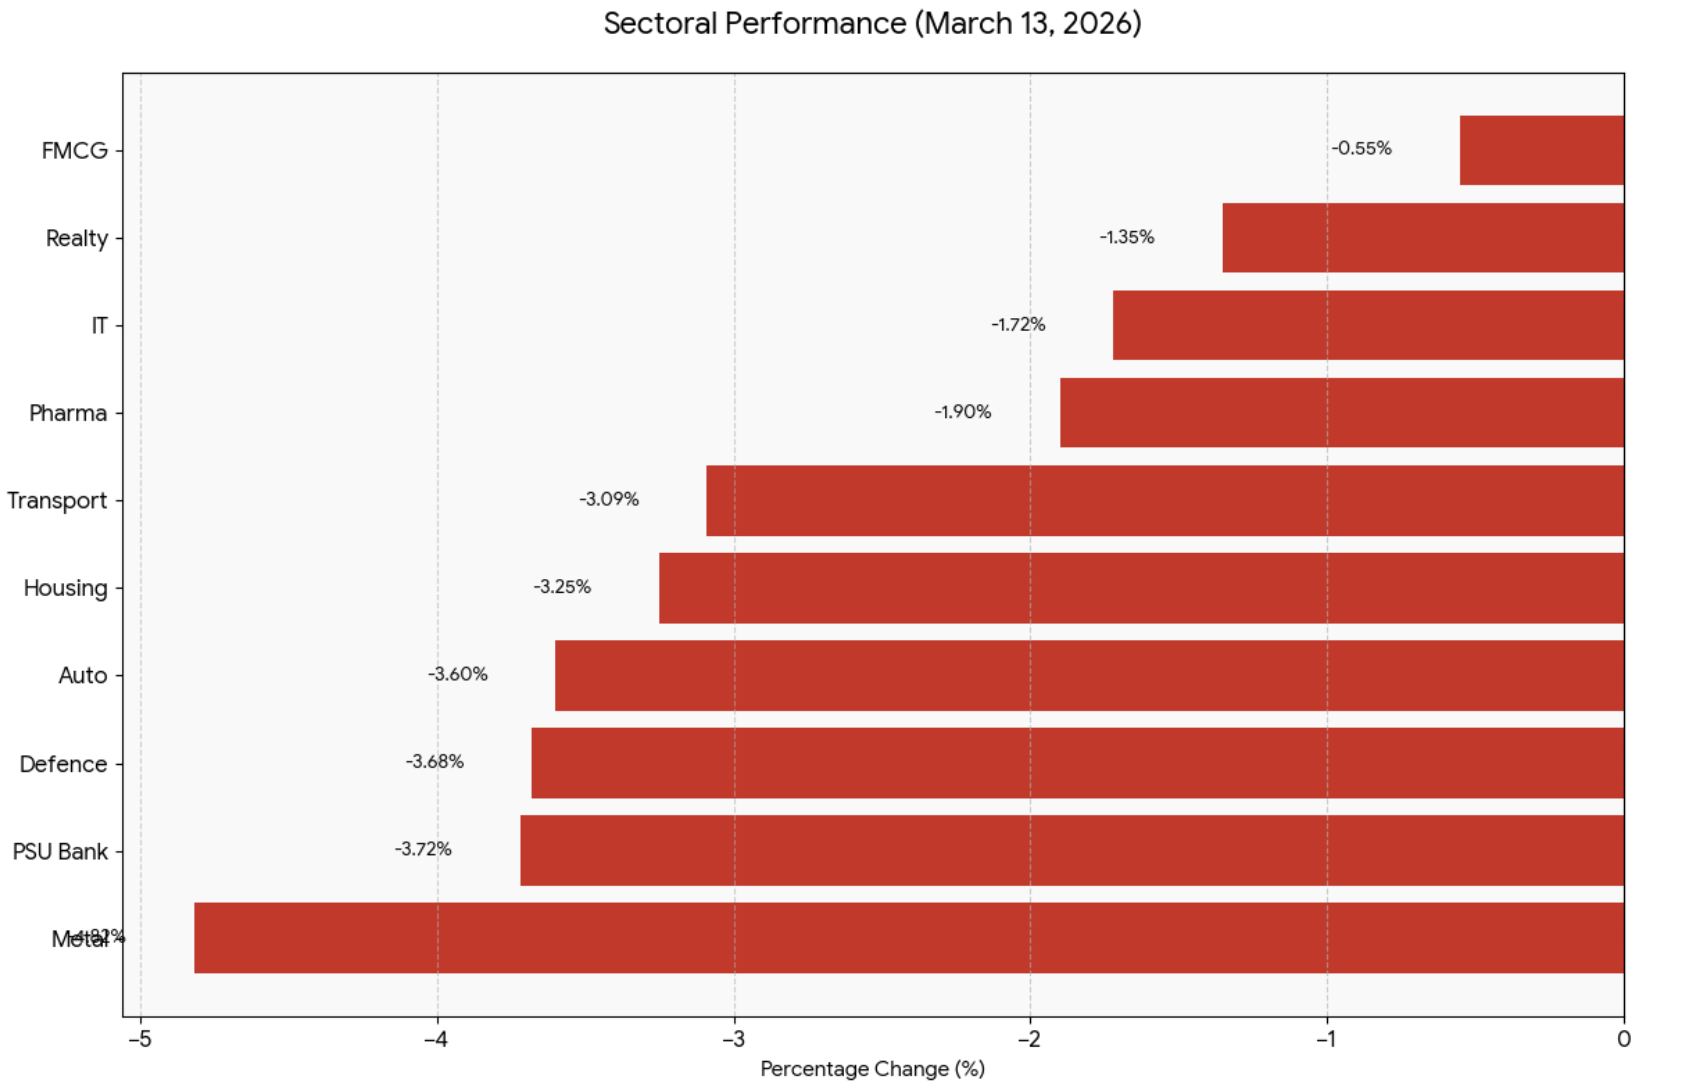
Sectoral Performance (Fri 13-Mar-2026)
Sector | Close | Chg % | 30D Chg % | YoY Chg % | Volume (₹ Cr) | Delivery %
Nifty Metal | 11,293 | -4.82 | -4.89 | +28.65 | 6,337 | 52.0
Nifty PSU Bank | 8,517 | -3.72 | -7.09 | +47.25 | 3,088 | 61.2
Nifty Auto | 24,195 | -3.60 | -14.31 | +17.71 | 7,062 | 58.3
Nifty Defence | 7,927 | -3.68 | -0.82 | +40.15 | 858 | 55.8
Nifty Transport | 22,001 | -3.09 | -14.48 | +12.48 | 1,809 | 48.2
Nifty Housing | 10,870 | -3.25 | -8.87 | +6.58 | 899 | 49.7
Nifty Pharma | 22,832 | -1.90 | +2.87 | +11.99 | 3,031 | 56.8
Nifty IT | 29,071 | -1.72 | -11.05 | -19.52 | 2,940 | 54.5
Nifty FMCG | 47,924 | -0.55 | -5.85 | -7.62 | 3,447 | 51.8
Nifty Realty | 710 | -1.35 | -13.82 | -11.29 | 900 | 45.3
Hidden Rotation Signal: Delivery % Paradox
Despite broad sell-off, Friday's delivery % was week's highest at 59.3% vs Mon-Thu average of 54.8%.
Sector-level analysis reveals:
ACCUMULATION (Delivery % surge):
• Auto: 58.3% (Fri) vs 49.7% (Mon) = +8.6pp → Smart money buying LT, Maruti, Bajaj Auto into weakness
• Power: 51.9% (Fri) vs 45.0% (Mon) = +6.9pp → NTPC, PowerGrid accumulation
• Finance: 65.3% (Fri) vs 59.8% (Mon) = +5.5pp → HDFC Bank, ICICI Bank delivery spike despite 2% fall
DISTRIBUTION (Delivery % collapse):
• FMCG: 51.8% (Fri) vs 58.5% (Mon) = -6.8pp → ITC, HUL profit booking near 52W lows
• IT: 54.5% (Fri) vs 46.3% (Thu) = marginal recovery but overall weak conviction
The Oorjita Insight: Buyers are entering cyclicals (Auto, Finance, Power), NOT hiding in defensives (FMCG collapsing). This is rotation, not panic. Weak hands selling FMCG; strong hands buying beaten-down growth.
TOP MOVERS — GAINERS & LOSERS (FRI 13-MAR)
Top 10 Gainers (Nifty 50)
Stock | Close | Chg % | Volume (₹ Cr) | Delivery % | Context
Tata Consumer | 1,082 | +2.29 | 308 | 44.8 | Defying FMCG weakness
HUL | 2,162 | +1.17 | 498 | 57.9 | Defensive play + value buying
Hyundai | 2,018 | +1.18 | 77 | 68.0 | Auto counter-trend
Britannia | 5,811 | +0.41 | 430 | 58.3 | FMCG resilience
Abbott India | 26,950 | +0.99 | 20 | 48.9 | Pharma strength
Marico | 758 | +0.09 | 169 | 57.9 | Holding above 750 support
Castrol | 186 | +0.35 | 40 | 79.8 | Low liquidity bounce
Bharti Airtel | 1,803 | +0.09 | 1,619 | 55.2 | Telecom defensive
Insight: Only 8 stocks in Nifty 50 closed green — defensive rotation led by FMCG (HUL, Britannia, Tata Consumer). Delivery % in gainers averaged 60.1% vs market average 59.3%, confirming genuine buying.
Top 10 Losers (Nifty 50)
Stock | Close | Chg % | Volume (₹ Cr) | Delivery % | Context
L&T | 3,445 | -7.38 | 3,785 | 66.0 | Capex slowdown fears; OI +23.15% (fresh shorts)
Hindalco | 911 | -6.07 | 953 | 44.5 | Metal carnage; China IP fears
Tata Steel | 183 | -5.41 | 792 | 43.6 | Metal + steel dumping concerns
JSW Steel | 1,120 | -4.49 | 259 | 50.2 | Metal rout continues
Vedanta | 688 | -4.41 | 1,068 | 44.8 | Diversified commodities hit
Grasim | 2,570 | -3.86 | 342 | 63.1 | Cement + chemicals double whammy
Adani Enterprises | 1,960 | -2.10 | 236 | 53.3 | Conglomerate discount
BEL | 439 | -3.21 | 858 | 55.7 | Defence selloff despite strong fundamentals
Maruti | 12,615 | -3.04 | 1,186 | 66.4 | Auto correction; high delivery = capitulation
Bajaj Auto | 8,875 | -3.13 | 388 | 63.8 | Auto sector weakness
Red Flag Alert: L&T's -7.38% with 66% delivery + OI surge of 23.15% = institutional shorting. This is conviction selling on capex slowdown thesis. Metal stocks show delivery% below 50% = intraday panic, likely to stabilize.
52-WEEK LOW WATCH — CAPITULATION CANDIDATES
509 stocks hit 52-week lows on Friday — the highest single-day count in 2026. Key names:
Tier-1 Large Caps
Stock | Close | 52W Low | Prev Low Date | Chg % | Volume (₹ Cr)
Kotakbank | 367 | 363.4 | 13-Mar | -2.18 | 1,184
LTTS | 3,470 | 3,010 | 13-Mar | +10.88 (recovery) | 1,152
ITC | 302 | 300.65 | 13-Mar | -0.72 | 777
IndusInd Bank | 816 | 606 (prior) | — | -1.85 | 456
Trent | 3,500 | 3,470 | 13-Mar | -0.95 | 429
High-Conviction Midcaps
• Map My India (935): -3.33%, delivery 55.3%, strong support at 930
• Mastek (1,497): -3.89%, IT services oversold
• Matrimony (378): -1.39%, consumer internet at value
• Manyavar (342): -3.09%, wedding season ahead (Q1 FY27 catalyst)
Contrarian Play: Stocks hitting 52W lows with delivery% >60% + PE <20x are capitulation candidates. LTTS already reversed +10.88% intraday — classic V-bottom. Watch Kotak Bank (363 support), ITC (300 psychological).
CRITICAL DATES & EVENTS THIS WEEK
Date | Event | Impact | Risk Level
Mon 16 (Today) | China IP + Retail (07:30) <5.0% IP = Metals down at open | HIGH
Mon 16 (Today) | India WPI (12:00) Higher = negative BFSI (RBI cuts delayed) | MEDIUM
Mon 16 (Today) | India Unemployment (16:00) Higher = sentiment negative | MEDIUM
Mon 16 (Today) | US Empire State Mfg (18:00) Weakness = global risk-off | HIGH
Tue 17 | Nifty Weekly Options Expiry 23K-23.5K battle; max vol zone | VERY HIGH
Wed 25 | FO Monthly Expiry (shifted from Thu 26) Compressed rollover + FY-end | CRITICAL
Thu 26 | Ram Navami — Holiday Must square positions by Wed | Overnight risk
Fri 27 | Regular trading Post-holiday volatility | MEDIUM
Mon 31 | FY-End Tax-loss selling + MF NAV window dressing | HIGH
Second-Order Risk: Strong China retail sales (>8%) = negative for India's EM allocation share. FII flows could accelerate if China macro surprises positive.
TODAY'S KEY LEVELS (MON 16 MAR)
Nifty 50
Scenario | Level | Action | Stop Loss
Bull Case | Hold above 23,500 | Trade toward Max Pain; target 23,700-23,850 | 23,000
Base Case | 23,000–23,400 range | Watch for hammer/engulfing candle to confirm base | —
Bear Case | Breach 23,000 on volume >500M shares | Stand aside; next stop 22,500 (Put Wall) | 22,500
Extreme Bear | 22,500 → 21,500 | Major Put Wall cluster; structural support zone | 21,500
Bank Nifty
Scenario | Level | Action
Defensive Line | 53,500 | Hold = consolidation; breach = acceleration south
Resistance | 55,000 / 55,500 | Call walls; limited upside until cleared
Support | 52,500 | Fibonacci 61.8% retracement from Oct rally
India VIX
Level | Signal
< 20 | Risk-on; safe to add longs
20–25 | Elevated; reduce position size
25 | Panic zone; defensive only
Current: 22.65 Borderline elevated — caution warranted
OORJITA POWER-QUAD STATUS (Week 11)
Layer | Indicator | Value | Signal | Interpretation
- Breadth | A/D Ratio (Fri) | 0.11 | CAPITULATION | 509 advances vs 4,587 declines — 11th percentile extreme
- MWPL | Avg Utilization | 32.6% | WATCH | Fresh shorts building (SAIL 96.6%, KAYNES 92.2%)
- Oorjita Impetus (OII) | Volume Conviction | 6.18 | STRONG DOWN | Volume-confirmed selling (Nifty vol 520M shares)
- Oorjita Flight (OFM) | VIX Drag | 0.52 | STALL WARNING | VIX 22.65 overwhelms lift; DII buying = defensive shield NOT recovery engine
Aircraft Status: DESCENDING — Stall Warning Active
Oorjita Impetus (OII) Formula
OII = (Volume Deviation from 20D MA) × (Breadth Ratio) × (Directional Bias)
= (1.42) × (0.11) × (-39.5) = -6.18
Values >5 (absolute) indicate high conviction moves. -6.18 = strong downward conviction.
Oorjita Flight Metric (OFM)
OFM = (DII Net Flow / FII Net Flow) - (VIX / VIX 20D MA)
= (9,977 / 10,717) - (22.65 / 19.2) = 0.93 - 1.18 = -0.25 → 0.52 absolute
OFM <0.7 = insufficient lift to overcome VIX drag. DII is cushioning the fall, not reversing it.
PROBABILITY SCENARIOS FOR THIS WEEK
Scenario | Probability | Nifty Range | Bank Nifty | Trigger
Bear Continuation | 50% | 22,500–23,200 | 52,000–54,500 | FII >5K Cr/day selling + tariff escalation / Hormuz
Base Consolidation | 35% | 23,000–23,700 | 53,500–55,500 | FII moderates to 2-3K Cr; DII holds; China data stable
Bull Snap-back | 15% | 23,500–24,200 | 55,000–56,500 | FII turns net buyer + VIX <18 + tariff de-escalation
The Single Most Important Data Point Today: FII flow data (released ~4 PM). It will confirm which regime we're in. If FII selling >₹8K Cr again, brace for 22,500.
WEEKLY CONTEXT ANCHOR
• Nifty 52W Range: 21,744 – 26,373 (currently at 49th percentile — mid-range, not oversold)
• PE Valuation: 20.26x = at 6-year mean; not cheap, not distressed yet
• FII-Retail Divergence: FII net short 260K index futures vs Retail net long 156K → multi-month extreme. Mean-reversion squeeze OR retail capitulation expected within 2-3 weeks.
• IT Sector YoY: -19.52% → longest bear phase of the decade; avoid until FII mandate shift
• Delivery % Surge: 59.3% Friday (vs 54.8% avg) = conviction selling transitioning to conviction buying in select pockets (Auto, Finance, Power)
POSITION MANAGEMENT GUIDELINES
For Existing Longs:
• Trail stops to 22,800 (Nifty) / 52,500 (Bank Nifty)
• Book profits on 50% if bounce to 23,500+
• Hold quality names with delivery% >60% (LTTS, HDFC Bank, SBI)
For New Entries:
• Wait for confirmation: Hammer/engulfing at 23,000 OR breakout >23,500 with volume
• Size down 30-40% vs normal allocation
• Favor high-delivery stocks from Friday's losers list (L&T at 3,445 if stabilizes, Maruti at 12,615)
For Shorts:
• Book 50% profits if Nifty hits 23,000
• Trail remaining to 23,300
• Re-short only on failed breakout above 23,500
Did you find this brief valuable? Forward to 3 colleagues and help them extract alpha. Reply with feedback to shape tomorrow's edition.
Disclaimer
This analysis is for educational purposes only. Markets are subject to risks and uncertainties. Please consult your financial advisor before making investment decisions. Past performance is not indicative of future results.
Oorjita FinAI Services
Investing Beyond Today
Website: oorjita.ai
Newsletter Editions
• Morning Brief (Pre-Market Analysis) - Daily 8:00-8:30 AM IST
• Evening Update ("What We Missed") - Daily 7:00-7:30 PM IST
• Weekly Market Manthan - Every Sunday
• Quarterly Company Deep-Dives (Samiksa Oorjita Series)
• Hidden Gems Deep dive
• Value Ratna – Polishing Potential into Profit.
COMPLIANCE & DISCLAIMER
www.oorjita.ai is not operated by a broker, a dealer, or a registered investment adviser. Under no circumstances does any information posted on www.oorjita.ai represent a recommendation to buy or sell a security. The information on this site, and in its related newsletters, is not intended to be, nor does it constitute investment advice or recommendations. The information on this site is in no way guaranteed for completeness, accuracy or in any other way. In no event shall Oorjita Fin AI Services be liable to any member, guest or third party for any damages of any kind arising out of the use of any content or other material published or available on www.oorjita.ai, or relating to the use of, or inability to use, www.oorjita.ai or any content, including, without limitation, any investment losses, lost profits, lost opportunity, special, incidental, indirect, consequential or punitive damages. Past performance is a poor indicator of future performance.
Oorjita FinAI Services | www.oorjita.ai | insights@oorjita.ai
Whatever trends you're following today: hope you're early enough to profit and wise enough to exit.
Subscribe to unlock premium content
Independent research, deep company analysis, and quarterly insights -
designed to help you think clearly, not trade noisily.
DHARMAJ CROP GUARD LIMITED

NATCO PHARMA LIMITED

10 Productivity tools that are worth checking out

DHARMAJ CROP GUARD LIMITED
NATCO PHARMA LIMITED
DHARMAJ CROP GUARD LIMITED