


Daily market intelligence that helps you track what matters, learn from what played out, and stay prepared for what’s next.

Popular articles


Comprehensive Investment Analysis: XPro India Limited
(XPROINDIA)
Analysis Date: February 11, 2026
Current Price: ₹977 | Market Cap: ₹2,472 Cr | 52-Week Range: ₹850 - ₹1,378
Small-Cap Specialty Chemicals | Flexible Packaging | Polymer Processing
1. Business Overview & Market Potential
Core Business Activities
XPro India Limited [finance:XPro India Limited] is a diversified polymer processing enterprise with over 40 years of legacy, established through corporate demerger in 1998. The company operates across three primary business segments:
Product Portfolio
• Dielectric/Capacitor Films (~30% market share in India): Specialty polypropylene films for power transmission, distribution, motor run, hybrid car capacitors, and energy storage applications
• BOPP Films (Biaxially Oriented Polypropylene): Used in packaging of adhesive tapes, bakery products, biscuits, confectionery, metalizing, and lamination
• Coextruded Sheets & Films (~68% of revenues): Refrigerator liners, automotive trims, luggage shells, disposable cups, furniture applications
• Thermoformed Components: Inner and door liners for refrigerators, automotive interior/exterior trims, sanitary products
Industry & Sub-Sectors
XPro operates in the flexible packaging and specialty films industry, serving multiple end-user segments:
• White goods (refrigerators) – established leadership position
• Automotive components
• Electrical/electronics (capacitors)
• FMCG packaging
• Industrial applications

Total Addressable Market (TAM) & Growth Prospects
India BOPP Films Market:
• Current Size (2026): USD 6.05 billion (₹54,450 crores at current exchange rates)
• Projected Size (2031): USD 7.62 billion (₹68,580 crores)
• CAGR (2026–2031): 4.72%
• Flexible packaging dominates: 67.90% market share driven by food and FMCG applications
Key Growth Drivers:
- Rising demand for flexible packaging in food, pharmaceuticals, and consumer goods
- E-commerce growth increasing packaging requirements
- Government initiatives promoting plastic recycling and sustainability
- Expanding electric vehicle market (capacitor films opportunity)
- Consumer durables sector recovery post-pandemic
Industry Life Cycle Stage
Mature with Pockets of Growth: The BOPP films industry in India is in a mature phase with moderate 4–5% CAGR, but specialty segments like dielectric films for EVs and energy storage represent emerging high-growth opportunities.
2. Market Positioning
Market Share & Competitive Standing
XPro India's Market Position:
• Dielectric/Capacitor Films: ~30% market share in India – Leadership position
• Refrigerator Sheets/Liners: Long-established leader, supplying most leading white goods brands
• Overall BOPP Market: Smaller player compared to giants like Uflex, Jindal Poly, Cosmo Films
Market Cap Comparison with Peers
• XPro India: ₹2,472 Cr
• Median peer market cap: ₹2,581 Cr
• Larger peers: EPL Ltd (₹6,646 Cr), AGI Greenpac (₹4,407 Cr), Uflex (₹3,429 Cr)
Brand Strength & Pricing Power
Strengths:
• Part of the prestigious Birla family business group, providing brand credibility
• 40+ years operational legacy in polymer extrusion/coextrusion
• Long-term relationships with leading refrigerator OEMs (Whirlpool, LG, Samsung likely customers)
• Specialty product focus in dielectric films offers differentiation
Pricing Power: Moderate – Operates in a competitive commodity-adjacent market with limited pricing power except in specialty dielectric films where technical specifications and quality consistency matter more than price.
3. Business Moats
Identified Competitive Advantages
1. Technical Specialization (Dielectric Films)
• Rating: 7/10
• 30% market share in niche dielectric/capacitor films segment
• High barriers to entry due to technical specifications, quality consistency requirements
• Application in mission-critical components (power transmission, EVs, energy storage) creates switching costs
• Production specifics considered trade secrets
2. Customer Relationships & Switching Costs
• Rating: 6/10
• Long-established supplier to major white goods manufacturers
• Thermoformed components designed specifically for OEM models create moderate switching barriers
• Qualification cycles for new suppliers in automotive/white goods are lengthy
3. Manufacturing Experience
• Rating: 5/10
• 40+ years of polymer processing expertise
• Multi-location operations (Barjora, etc.) provide operational resilience
• However, technology and equipment can be replicated by well-capitalized competitors
4. Birla Family Association
• Rating: 4/10
• Brand credibility from association with India's largest industrial house
• Access to capital and business network
• Limited tangible operational advantage in day-to-day business
Moat Durability Assessment
Narrow Moat with Specialty Pockets: XPro's competitive advantages are modest and vulnerable in the commoditized BOPP/coextruded sheets business (70% of revenue), but sustainable in dielectric films (30% market share) where technical barriers and customer validation cycles provide 5–7 year durability.
4. Moat Rating & Overall Competitive Score
Comprehensive Moat Assessment
Moat Factor | Rating (1–10) | Weight | Weighted Score
Technical Specialization (Dielectric) | 7 | 25% | 1.75
Customer Relationships | 6 | 20% | 1.20
Manufacturing Expertise | 5 | 15% | 0.75
Brand (Birla Association) | 4 | 10% | 0.40
Cost Leadership | 3 | 15% | 0.45
Network Effects | 2 | 5% | 0.10
Regulatory Barriers | 3 | 10% | 0.30
Overall Competitive Advantage Score: 4.95/10 (Narrow Moat)
Interpretation: XPro India possesses a narrow economic moat driven primarily by technical specialization in dielectric films and established customer relationships in refrigerator liners. The moat is insufficient to command premium valuations over extended periods, making the business susceptible to competitive pressures in its core BOPP/coextruded segments.
5. Recent Quarterly Performance (Q3 FY26)
Q3 FY26 vs Q3 FY25 Comparison (Consolidated)
Metric | Q3 FY26 | Q2 FY26 | Q3 FY25 | QoQ Change | YoY Change
Net Sales | ₹106.31 Cr | ₹119.91 Cr | ₹104.55 Cr | -11.34% | +1.68%
Operating Profit (excl OI) | ₹10.62 Cr | ₹7.33 Cr | ₹10.56 Cr | +44.88% | +0.57%
Operating Margin (excl OI) | 9.99% | 6.11% | 10.10% | +388 bps | -11 bps
Other Income | ₹4.10 Cr | ₹4.07 Cr | ₹4.99 Cr | +0.74% | -17.84%
Profit Before Tax | ₹9.80 Cr | ₹6.70 Cr | ₹10.67 Cr | +46.27% | -8.15%
Tax Rate | 30.41% | -46.13% | 26.60% | — | +380 bps
Net Profit | ₹6.78 Cr | ₹4.97 Cr | ₹7.47 Cr | +36.42% | -9.24%
PAT Margin | 6.42% | 4.14% | 7.14% | +228 bps | -72 bps
Interest Cost | ₹1.95 Cr | ₹1.72 Cr | — | +13.37% | —
Depreciation | ₹2.97 Cr | ₹2.98 Cr | — | -0.34% | —
Employee Cost | ₹9.39 Cr | ₹8.38 Cr | — | +12.05% | —
Estimated based on reported PAT and depreciation/interest
Key Observations
• Revenue volatility: 14% sequential decline in Q3 reflects seasonal patterns and order lumpiness.
• Profit recovery: Despite lower revenue, profit improved 76% QoQ, suggesting better product mix or cost management.
• Margin concerns: YoY EBITDA margin compression of 380 bps indicates raw material inflation or competitive pricing pressure.
Q3 FY26 vs Q2 FY26 Sequential Comparison
Metric | Q3 FY26 | Q2 FY26 | QoQ Change
Revenue | ₹106.31 Cr | ₹123.98 Cr | -14.3%
Net Profit | ₹6.78 Cr | ₹4.97 Cr | +75.7%
Key Observations
• Revenue volatility: 14% sequential decline in Q3 reflects seasonal patterns and order lumpiness.
• Profit recovery: Despite lower revenue, profit improved 76% QoQ, suggesting better product mix or cost management.
• Margin concerns: YoY EBITDA margin compression of 380 bps indicates raw material inflation or competitive pricing pressure.
Other Income Dependency – CRITICAL QUALITY ISSUE
New Finding (Not in Original Report):
• Q3 FY26 Other Income: ₹4.10 Cr = 41.84% of PBT
• Q2 FY26: Other Income = 60.75% of PBT
• FY25: Other Income = 34.62% of PBT
Red Flag: XPro's reported profits are HEAVILY dependent on non-operating income (treasury, interest, etc.), NOT core business operations
9-Month Performance (Apr–Dec 2025)
Metric | 9M FY26 | 9M FY25 | Change
Net Sales | ₹371.12 Cr | ₹377.07 Cr | -1.58%
Net Profit | ₹6.27 Cr* | ₹34.53 Cr | -81.8%
PAT Margin | 1.69% | 9.16% | -747 bps
CRITICAL INSIGHT: 9-Month Consolidated Performance
9-month profit declined -81.8% YoY (₹6.31 Cr vs. ₹34.53 Cr), driven by:
- Q1 FY26 Consolidated Loss of ₹5.48 Cr (first quarterly loss in history)
- India operations: Profitable at ₹4.30 Cr
- UAE subsidiary: Loss of ~₹9.8 Cr (startup phase + forex)
- Forex losses: ₹16.7 Cr at consolidated level
- India standalone: ₹10.4 Cr impact
- UAE additional: ₹6.3 Cr impact
- Margin compression across India operations
UAE Subsidiary Context
- Accumulated losses (9M): ~₹12.6 Cr
- Status: Pre-revenue/commissioning phase
- Upside scenario: If UAE achieves breakeven by FY28, consolidated earnings could improve 30–40%
- Downside scenario: Continued losses through FY27
Assessment: We use consolidated figures for conservative analysis, but investors should monitor standalone India metrics for core business health.

6. Annual Performance (FY2025 & Historical Trends)
FY2025 Full-Year Results
Metric | FY2025 | FY2024 | FY2023 | YoY Change (FY25 vs FY24)
Revenue | ₹532.6 Cr | ₹463.0 Cr | ₹509.0 Cr | +15.0%
Operating Profit | ₹51.0 Cr | ₹66.0 Cr | ₹74.0 Cr | -22.7%
OPM % | 9.6% | 14.3% | 14.5% | -470 bps
Net Profit | ₹38.0 Cr | ₹44.0 Cr | ₹45.0 Cr | -13.6%
EPS | ₹17.04 | ₹19.91 | ₹24.91 | -14.4%
ROE | 6.56% | 7.93% | ~13% | Deteriorating
ROCE | 7.93% | 15% | 25% | Steep decline
Key Trends & Concerns
Revenue Growth: Improved to 15% in FY2025 after flat FY2024, but still below historical 5-year CAGR of 9%
Margin Compression: Operating margins collapsed from 14–15% (FY23–24) to 9.6% (FY25), indicating:
• Raw material inflation (polypropylene prices ranged $1,230–$1,334/MT in 2023)
• Competitive pricing pressure in BOPP segment
• Under-utilization of capacity during expansion phase
Return Ratios Deteriorating:
• ROE declined from 13% (3-year avg) to 6.56% (FY25)
• ROCE crashed from 25% (FY23) to 7.93% (FY25)
• Indicates capital deployment in expansion not yet generating returns
Debt Reduction Success: Company repaid ₹15.31 Cr term debt ahead of schedule; now
• Long-term Debt: ₹200.58 Cr (as of March 2025)
• YoY Increase: +930.51% (from ₹19.47 Cr in FY24)
• Debt-to-Equity (H1 FY26): 0.46x (highest in recent years)
• Debt-to-EBITDA: 2.84x (5-year average)
Context: This massive debt surge is for Barjora expansion funding via Euro-denominated borrowings
Historical Performance (5/10-Year View)
Compounded Growth Rates:
• Sales CAGR (5Y): 8.56% – poor compared to industry 4–5% + inflation
• Sales CAGR (10Y): 8%
• Profit CAGR (5Y): 138% (from negative base post-2015–17 losses)
• Profit CAGR (3Y): -5% (declining trend)
Stock Performance:
• 5-Year CAGR: 109%
• 1-Year Return: -22% (stock at ₹1,053 from 52-week high of ₹1,378)
7. Strategic Investments & Execution
Major Capital Investments (FY24–FY26)
- Barjora Dielectric Films Capacity Expansion
• Investment: EUR-denominated equipment financing (₹40–50 Cr estimated)
• Capacity: New production line for capacitor films
• Timeline: Installation completed December 2025; wet trials ongoing; production expected Q4 FY26
• Delays: Supplier issues caused postponement from original Q3 FY26 target
• Status: Partially Executed – 6–9 month delay versus initial expectations - Solar Energy Partnership
• Investment: ₹2 Cr for 26% stake in Tata Power Renewable Energy Limited
• Purpose: Reduce energy costs via captive solar supply
• Expected Impact: Significant cost reduction (energy is major input cost)
• Status: In Progress – expected commissioning Q3–Q4 FY26 - UAE Subsidiary Formation (Xpro Dubai FZCO – XDF)
• Investment: AED 33,087,500 raised (₹75 Cr approx); Xpro retains 85% ownership
• Purpose: Enhance global supply chain, access Middle East markets
• Status: Established – 13,235 Class A shares allotted December 2025
Status: Established (external investor OASIS II took 15% stake)
Financial Impact (9M FY26)
- Revenue contribution: Nil (pre-commissioning)
- Accumulated losses: ~₹12.6 Cr drag on consolidated P&L
- Management guidance: Commissioning Q4 FY26, production Q1–Q2 FY27
Investment View
Bullish case: UAE could add ₹50–100 Cr revenue with 15–18% margins by FY28, improving consolidated earnings by 30–40%
Cautious view: Barjora already delayed 6–9 months; UAE execution risk HIGH
Bearish case: Continued losses through FY27
Our Stance: UAE is currently an earnings overhang (reducing EPS by ₹2–3/share). However, if operational by FY27–28, could be significant re-rating catalyst.
- Future Capacity Expansion (BOPP Films)
• Investment: Two advanced manufacturing lines acquired
• Timeline: First line operational by FY2025, second by FY2026
• Funding: 85% through supplier credit; significant payments expected in FY26
• Status: Ongoing – significant capex in FY25 (₹320 Cr investing cash outflow) and FY26
“Say to Do” Ratio Assessment
Execution Score: 6/10 (Moderate)
Positives:
• Successfully raised capital (QIP/preferential issues in FY24–25) totaling ₹200+ Cr
• Repaid term debt ahead of schedule
• UAE subsidiary established on schedule
• Production tonnage increased 4.8% despite capacity constraints
Concerns:
• Barjora dielectric line delayed 6–9 months due to supplier issues
• Revenue growth lagging despite capacity additions (FY24: -9%, 9M FY26: -1.6%)
• Margin erosion during expansion phase (OPM down 470 bps in FY25)
• Forex losses from Euro borrowings not adequately hedged
Management Commentary (FY2025 Annual Report)
“Management focuses on fundamentals over short-term targets... strategic elements include global scaling of capacity, product advances, and sustainable cost competitiveness”
This suggests a long-term orientation but also provides management flexibility to miss near-term guidance without accountability.
8. Raw Materials & Supply Chain Advantages
Key Raw Materials
Primary Input: Polypropylene (PP) Resin
• Accounts for ~60–70% of product cost (estimated)
• Sourced domestically and internationally
• Petrochemical derivative (linked to crude oil prices)
Secondary Inputs:
• Polyethylene (PE), Polystyrene (PS), ABS resins for coextruded sheets
• Additives, masterbatches, stabilizers
Current Raw Material Pricing Environment
Polypropylene Price Trends (2024–2026):
Region | Price (USD/MT) | Trend
India (BOPP grade, Jan 2024) | $1,303 | Stable
India (Mar 2024) | $1,307 | Flat
China (Q2 2024) | $1,061–$1,075 | Range-bound
China (Jun 2025) | $976 | -8% YoY
Europe (Jun 2025) | $1,160 | -9% YoY
Analyst Outlook: “Polypropylene prices expected to show range-bound oscillations influenced by feedstock fluctuations and regional variations”
Supply Chain Advantages
Identified Strengths:
- Multi-location manufacturing reduces logistics costs and provides proximity to white goods hubs (refrigerator manufacturers)
- Supplier credit financing (85% of capex funded via vendor credit) indicates strong supplier relationships
- UAE subsidiary (XDF) provides sourcing optionality and access to Middle East petrochemical supplies at potentially lower costs
Limitations:
• No evidence of exclusive raw material contracts or backward integration
• Commodity exposure to PP price volatility (margin compression in FY25 likely driven by RM inflation)
• Limited pricing power to pass through RM cost increases in competitive BOPP segment
9. Supply Chain Dependencies & Geopolitical Risks
Critical Sourcing Dependencies
- Polypropylene Resin Imports
• Key Suppliers: Middle East (Saudi Arabia, UAE, Qatar), China, South Korea
• Dependency Level: HIGH – India imports ~30–40% of PP requirements
Geopolitical Risk:
• Middle East instability (Red Sea shipping disruptions, Iran–Israel tensions)
• China export restrictions or dumping
• Global crude oil price shocks
- Euro-Denominated Equipment Financing
• Exposure: Significant borrowings in EUR for Barjora expansion
• Risk Realized: ₹15+ Cr forex losses in 9M FY26 due to INR depreciation (₹/EUR rate moved from ~88 to ~92)
• Mitigation: Inadequate – company appears to have limited hedging strategy - European Machinery Suppliers
• Dependency: Advanced film lines sourced from European OEMs
• Risk: Supply chain delays already experienced (Barjora line postponed)
• EUR forex exposure: Ongoing payment obligations create continued currency risk
Geopolitical Risk Assessment
Risk Level: MODERATE–HIGH
Key Vulnerabilities:
- Crude oil price spikes (Brent at $68.86/bbl, up from $65.97 month ago) directly impact PP costs
- China factor: Cheap Chinese BOPP imports could pressure domestic pricing; however, India's anti-dumping duties provide some buffer
- Currency volatility: INR at 90.48/USD (near all-time high of 92.29) increases import costs and forex losses
- Middle East tensions: Disruptions in Red Sea shipping routes increase freight costs and lead times
Mitigation Strategies (Current/Recommended)
• UAE subsidiary provides Gulf sourcing options
• Natural hedge via exports (₹13.4 Cr in FY25, down from prior years) – currently weak
• No evidence of multi-year fixed-price PP contracts
• Limited forex hedging on EUR borrowings
10. Raw Material Shortage Risks
Potential Shortage Scenarios
- Crude Oil Supply Disruptions
• Trigger Events: OPEC production cuts, Middle East conflicts, Russia-Ukraine escalation
• Impact on XPro: PP prices could spike 20-30% within months, compressing margins by 500-800 bps
• Probability: MODERATE (geopolitical tensions elevated in 2026) - Naphtha Cracker Shutdowns
• Context: PP is derived from naphtha/propylene produced by refineries and crackers
• Risk: Unplanned shutdowns at major Indian refineries (Reliance, IOCL) or imported naphtha shortages
• Impact: Domestic PP supply tightness, 10-15% price spikes
• Probability: LOW (India has diversified refining capacity) - China Export Restrictions
• Context: China produces 30% of global PP; has history of restricting exports for domestic priorities
• Impact: Global PP prices rise 10-20%; Indian imports become expensive
• Probability: MODERATE (trade tensions with US/West could trigger) - Environmental Regulations
• Risk: Stricter plastic regulations could limit PP production or increase costs via carbon taxes
• India Context: Government promoting plastic recycling but not restricting virgin PP production currently
• Probability: LOW near-term, MODERATE 3-5 years
Company's Mitigation Strategies
Current Measures (Per Management):
"The Company maintains healthy relationships with suppliers and focuses on sustainable cost competitiveness"
Assessment: INADEQUATE - Generic statements without evidence of:
• Strategic inventory building
• Multi-year supply contracts
• Backward integration plans (PP manufacturing)
• Alternative material R&D
Recommended Actions:
- Establish 3-6 month strategic PP inventory during price troughs
- Negotiate multi-year volume commitments with Reliance/IOCL for price stability
- Develop bio-based PP alternatives for sustainability-focused customers
- Increase UAE subsidiary's role in Gulf PP procurement
11. Industry-Specific Sales Risks
Macro & Sectoral Headwinds
- White Goods (Refrigerators) - 68% of Revenue Exposure
Risk Factors:
• Demand cyclicality: Consumer durables tied to GDP growth, rural income, housing starts
• Current Environment: India GDP growth slowing to 6.5-7% (from 8%+); rural demand weak
• Competitive Intensity: Refrigerator market dominated by LG, Samsung, Whirlpool, Godrej - strong buyer power
• Impact on XPro: Pricing pressure, volume volatility, extended payment terms (debtor days increased 44→53 days)
Management Commentary:
"Optimistic outlook in consumer durables sector" but acknowledges "sub-optimal market circumstances"
Mitigation: Limited - captive to white goods cycle
- Automotive Components - Small but Growing
Risk Factors:
• Auto industry slowdown: Passenger vehicle sales volatile, electric vehicle transition uncertain
• Import substitution risk: Cheaper Chinese auto parts flooding Indian market
• Impact: XPro's automotive thermoformed parts face competitive pressure
Opportunity:
• EV growth creates demand for lightweight polymer components
• Localization push under PLI schemes benefits domestic suppliers
- BOPP Films for FMCG Packaging
Risk Factors:
• Commodity trap: Low differentiation, severe competition from Uflex, Jindal Poly, Cosmo Films
• Overcapacity: Cosmo Films alone adding 60,000 MT capacity in 2025
• Impact: Pricing pressure, margin erosion (XPro's OPM down to 9.6% in FY25)
Mitigation: Focus on specialty films, value-added products with higher barriers
- Capacitor/Dielectric Films - Strategic Growth Segment
Opportunity Drivers:
• EV revolution: Electric vehicles require power capacitors
• Renewable energy: Solar/wind inverters use film capacitors
• Energy storage: Grid-scale battery systems need capacitor banks
• India manufacturing push: PLI for electronics, semiconductors
Risk Factors:
• Technology shift: Ceramic capacitors or alternative technologies could disrupt film capacitors
• Import competition: Chinese/South Korean capacitor films at lower prices
• Barjora delay: New capacity postponed to Q4 FY26, losing first-mover advantage
Assessment: HIGH POTENTIAL but execution delays problematic
Overall Sales Risk Level: MODERATE-HIGH
Downside Scenario: White goods slowdown + BOPP overcapacity → revenue flat/declining, margins sub-8%
Base Case: Modest 5-8% revenue growth, margins stabilize at 10-11%
Upside Scenario: Dielectric films ramp-up + EV adoption → 12-15% revenue growth, margins expand to 13-14%
12. Research, Technology & Intellectual Property
R&D Spending & Focus Areas
Disclosed R&D Information: LIMITED - Annual reports do not break out R&D expenditure separately
Inferred R&D Activities (from management commentary):
• "Continuous product development is a key area"
• Developing thinner BOPP films (6-8 micron vs. standard 12-15 micron) for higher-value applications
• Advancing dielectric film formulations for higher voltage/temperature ratings
• Working on sustainable/recyclable film solutions
R&D Intensity (Estimated): <1% of sales (likely ₹3-5 Cr annually)
Comparison with Peers:
• Uflex: ~2-3% of sales on R&D (₹100-120 Cr)
• Polyplex: ~1.5-2% of sales
Assessment: UNDER-INVESTED in R&D relative to market leaders
Patent Portfolio
Public Patent Search Results: No significant patent portfolio disclosed in public filings
Proprietary Knowledge:
• "Production specifics considered trade secrets" for dielectric films
• Process know-how in co-extrusion and thermoforming
• Customer-specific formulations for refrigerator liners
IP Assessment: WEAK - Minimal patent protection; competitive advantage relies on:
- Process expertise (not patented, vulnerable to talent poaching)
- Customer qualification (moderate switching costs)
- Trade secrets (difficult to enforce in India)
Technology Leadership
Current Standing: FOLLOWER in mainstream BOPP; LEADER in niche dielectric films
Technology Gaps:
• Advanced coating technologies (vs. Cosmo Films, Uflex)
• Metallization capabilities (XPro outsources, doesn't have in-house)
• Biodegradable/compostable film development (emerging requirement)
Innovation Pipeline: OPAQUE - No public disclosure of new product development roadmap
Recommendation: XPro needs to increase R&D intensity to 2-3% of sales and establish IP protection for specialty formulations to defend dielectric films moat.
13. Segment Analysis
Business Segment Breakdown
Segment | Revenue Mix | Profitability | Growth Trend | Risk Level
Coex Division (Sheets/Liners) | ~68% | Low (5-8% OPM est.) | Flat to declining | MODERATE
Specialty Films (Dielectric/Capacitor) | ~20-25% | High (18-22% OPM est.) | Growing 8-12% | LOW-MODERATE
BOPP Films (Packaging) | ~7-10% | Very Low (3-5% OPM est.) | Volatile | HIGH
Other Income (Treasury/Interest) | ₹15.6 Cr (FY25) | N/A | Variable | LOW
Geographic Breakdown
Domestic (India): ~95-97% of sales
Exports: ₹13.4 Cr (FY25), down from prior years due to "capacity constraints"
Export Limitations: Company acknowledges exports are "limited by capacity constraints" and prioritizes domestic market
Future Strategy: UAE subsidiary (XDF) aims to enhance export competitiveness, but no specific targets disclosed
Segment-Specific Risks & Mitigation
- Coex Division (Refrigerator Liners) - 68% Revenue
Risks:
• Customer concentration in 3-4 major white goods OEMs
• Demand tied to refrigerator production cycles (volatile)
• Limited export growth (capacity-constrained)
• Low margins due to commodity nature
Mitigation Strategies:
• Diversification into automotive trims, luggage shells (incremental progress)
• New capacity expansion underway but delayed
• No disclosed strategy to reduce customer concentration
Assessment: HIGH DEPENDENCY, MODERATE RISK - Established market leadership provides stability but limited growth runway
- Specialty Films (Dielectric/Capacitor) - 20-25% Revenue
Risks:
• Technology disruption (ceramic capacitors replacing film capacitors in some applications)
• Chinese competition in capacitor films
• Barjora capacity expansion delayed 6-9 months
Mitigation & Growth Drivers:
• EV and renewable energy adoption driving structural demand growth
• 30% market share provides pricing stability
• High technical barriers (quality consistency, certification requirements)
• Capacity expansion will enable market share gains post-commissioning
Assessment: STRATEGIC GROWTH ENGINE - Highest margin, best moat, favorable macro trends
- BOPP Films (Packaging) - 7-10% Revenue
Risks:
• Severe overcapacity in Indian BOPP market (Cosmo adding 60,000 MT)
• Commodity product, no differentiation
• XPro is small player vs. Jindal Poly, Uflex, Polyplex
• Likely loss-making or breakeven segment
Mitigation:
• Management mentions "targeting higher-value products over cheaper imports"
• Focus on specialty BOPP (metalized, thermal lamination grades)
Assessment: DIVEST/DE-EMPHASIZE CANDIDATE - Strategically questionable to compete in commoditized BOPP; better to focus capital on dielectric films.
UAE Subsidiary (XDF) | 0% (Pre-revenue) | Loss-making | Startup | HIGH risk
9M FY26 Impact: -₹12.6 Cr on consolidated earnings
Target: Middle East market + global exports
Risk: Execution delays, forex volatility, market acceptance
Segment Recommendations
Strategic Priorities
- ACCELERATE: Dielectric films capacity & market share (target 40% India market share by FY28)
- STABILIZE: Coex refrigerator liners through customer diversification + export growth via UAE
- EXIT/MINIMIZE: Commodity BOPP films – redeploy capital to higher-ROCE segments
14. Shareholding Pattern Changes
Shareholding Pattern (Dec 2025 vs. Jun 2025)
Category | Dec 2025 | Sep 2025 | Jun 2025 | Mar 2025 | Change (6M)
Promoters | 40.31% | 40.31% | 42.43% | 42.43% | -2.12%
FII (Foreign) | 14.63% | 14.92% | ~14.5% | ~14% | +0.63%
DII (Domestic) | 2.32% | 2.57% | ~2.5% | ~2.3% | -0.18%
Mutual Funds | 0.84% | 0.79% | 0.82% | 0.76% | +0.02%
Retail & Others | 41.90% | 41.00% | 40.80% | 40.56% | +1.10%
Key Changes & Implications
1. Promoter Stake Reduction (-2.12% in Q3 FY26)
Context: Promoter holding declined from 42.43% (Jun 2025) to 40.31% (Dec 2025)
Possible Reasons:
• Dilution from preferential allotment/QIP to fund expansion (likely explanation given ₹200+ Cr capital raise in FY24-25)
• Promoter selling (concerning if true, but not evident from disclosures)
Management Statement:
"Latest issues marked the end of foreseeable capital-raising actions"
Assessment: NEUTRAL to MILDLY POSITIVE – Dilution from institutional capital raise for growth is acceptable; promoter stake remains substantial at 40.31%
2. FII Interest Increasing (+0.63% over 6 months)
FII holding gradually increased from ~14% (Mar 2025) to 14.63% (Dec 2025)
Interpretation:
• Foreign institutions building positions post-QIP at lower valuations
• Potential recognition of dielectric films opportunity in EV/energy storage theme
• However, absolute FII holding remains LOW (<15%), limiting liquidity
3. Retail Shareholding Rising (+1.10%)
Retail investors increasing stake from 40.56% (Mar 2025) to 41.90% (Dec 2025)
Implications:
• Positive: Broader investor base, reduced volatility from large block trades
• Concern: High retail holding (42%) can lead to sentiment-driven price swings
• Limited institutional following (MF only 0.84%) suggests lack of analyst coverage
Institutional Activity Summary
Net Institutional Stance: NEUTRAL to MILDLY POSITIVE
• Incremental FII buying suggests international recognition
• Low MF holding (0.84%) indicates domestic institutional skepticism
• Minimal DII interest (2.32%) limits domestic demand support
Liquidity Concern: Combined promoter (40.31%) + retail (41.90%) = 82.21% held by less liquid shareholders → stock prone to volatility on low volumes
15. Brokerage Recommendations
Analyst Ratings & Target Prices
Current Consensus (February 2026):
DATA LIMITATION: XPro India has minimal sell-side coverage – no tier-1 brokerage (Motilal Oswal, ICICI Direct, Kotak, HDFC Sec) publishes regular research notes
Available Recommendations
1. MarketsMojo (February 2026)
• Rating: STRONG SELL
• Rationale: "Technical momentum shifts amid bearish sentiment"
• Context: Q3 FY26 results showed "profit recovery but margin erosion concerns"
2. Technical/Retail Target Prices (2026 Projections)
Source | Target 1 | Target 2 | Target 3 | Methodology
Stock Price Archive | ₹1,581 (+42.9%) | ₹1,597 (+44.3%) | ₹1,627 (+47.1%) | Fibonacci Extension
Saras Market | ₹1,001 (-4.9%) | ₹1,080 (+2.6%) | — | Price Action Chart
Daily Bulls | ₹2,032 (+92.9%) | — | — | Bullish 2026 scenario
Assessment: Wide variance in retail price targets (₹1,001 to ₹2,032) reflects lack of consensus and limited fundamental analysis
Intrinsic Value Estimates
Smart-Investing.in (Feb 2026):
• Intrinsic Value: ₹329.11 (based on median of 3 historical models)
• Current Price: ₹1,053
• Implied Overvaluation: 220% or 3.2x intrinsic value
Interpretation: Conservative DCF/Graham-style valuation suggests significant overvaluation at current price
Consensus Summary
Rating Distribution (Estimated):
• Buy: 0–10%
• Hold: 20–30%
• Sell: 60–70%
• No Coverage: Majority
Target Price Range: ₹1,000 – ₹1,600
Key Arguments by Analysts
Bearish Case:
• Margin erosion (OPM 9.6% in FY25 vs. 14–15% historically)
• Poor ROE/ROCE (6.6% / 7.9% below cost of capital)
• Capacity expansion delays and execution risks
• High valuation (P/E 166.23, P/B 4.68x)
• Promoter stake dilution
• Forex losses from Euro borrowings
Bullish Case (Where Present):
• Dielectric films growth driven by EV/energy storage themes
• Birla family pedigree and financial stability
• Debt-free balance sheet post-term loan repayment
• Capacity expansion unlocking growth from FY27
• 30% market share in high-margin niche segment
Oorjita Assessment: The lack of institutional research coverage is a RED FLAG – indicates small-cap illiquidity, limited investor interest, and insufficient information flow for informed decision-making.
16. Technical Analysis: Share Price Trends
Current Technical Setup (February 2026)
Price: ₹1,053 | 52-Week Range: ₹850 – ₹1,378 | YTD Return: -10.5%
Moving Average Analysis
Indicator | Level | Current vs. MA | Signal
50-Day MA | ~₹1,150 (est.) | Below | Bearish
100-Day MA | ~₹1,200 (est.) | Below | Bearish
200-Day MA | ~₹1,100 (est.) | Near | Neutral
Interpretation: Stock trading below short-term (50D) and medium-term (100D) moving averages indicates downtrend
Support & Resistance Levels
Pivot Point Analysis (Intraday – 5 min timeframe):
• Pivot Point: ₹1,220.2
• Resistance: R1 ₹1,234.4 | R2 ₹1,253.5 | R3 ₹1,267.7
• Support: S1 ₹1,201.1 | S2 ₹1,186.9 | S3 ₹1,167.8
Swing Trading Levels (Weekly/Monthly):
• Major Resistance: ₹1,330–₹1,378
• Critical Support: ₹1,000
• Breakdown Level: ₹850
Momentum Indicators
RSI: Not explicitly provided; price action suggests ~45–50 (neutral to mildly oversold)
MACD: "Technical momentum shifts amid bearish sentiment" indicates bearish crossover likely in Jan–Feb 2026
Volume Analysis
Recent Volume Trends:
• "Week closes at Rs.959.10, down 1.19% on low volume" (Feb 6, 2026)
• Low volumes during decline suggest lack of conviction
• Institutional participation remains minimal
Chart Patterns & Signals
Pattern Identified: Descending Triangle
• Bearish continuation if ₹1,000 breaks
• Bullish invalidation above ₹1,200 with volume
Technical Outlook Summary
Short-Term (1–3 months): BEARISH
• Below key moving averages
• MACD bearish
• Resistance at ₹1,200–₹1,220
• Downside risk to ₹1,000
Medium-Term (6–12 months): NEUTRAL
• Consolidation ₹1,000–₹1,200
• Fibonacci targets ₹1,580–₹1,627 on breakout
• Fundamental catalyst required (Barjora commissioning Q4 FY26)
Trading Strategy
• Aggressive: Buy near ₹1,000, stop-loss ₹950, target ₹1,200
• Conservative: Enter only above ₹1,220 with volume
• Avoid: Chasing ₹1,050 levels
Key Technical Events to Watch
- Q4 FY26 Results (May 2026)
- ₹1,000 Support Test
- Volume Expansion
17. Competition Analysis
Key Competitors Identification
Competitor | Market Cap (₹ Cr) | P/E | ROCE | Sales (₹ Cr) | Net Profit (₹ Cr) | Key Strengths
Uflex Ltd | 3,429 | 10.8x | 7.75% | ~15,000+ | ~300+ | Largest integrated flexible packaging player
Polyplex Corp | 2,786 | 38.0x | 7.16% | ~7,000+ | ~75+ | Global polyester film leader
Cosmo Films | 1,831 | 12.5x | N/A | ~3,000+ | ~150+ | BOPP specialist
Jindal Poly Films | ~3,500+ | N/A | N/A | ~6,000+ | N/A | Backward integration advantage
XPro India | 2,472 | 166.23x | 7.93% | 533 | 38 | Niche dielectric films focus
Competitive Positioning Matrix
Segment | Leader | XPro Standing | Gap Analysis
BOPP Films | Uflex, Jindal Poly | Minor player | 10–20x scale gap
Polyester Films | Polyplex, Ester | Not present | N/A
Dielectric Films | XPro India | Co-leader | Niche dominance
Refrigerator Liners | XPro India | Leader | Established position
Specialty Coatings | Cosmo, Uflex | Follower | Limited capabilities
Comparative Financial Performance (Latest Quarterly)
Company | Q3 Revenue (₹ Cr) | QoQ Growth | YoY Growth | OPM % | Net Profit (₹ Cr) | QoQ Profit Change
EPL Ltd | 1,206 | +11% | +11% | ~14% | 106.1 | +20%
AGI Greenpac | 602 | 0% | 0% | ~19% | 76.1 | +6%
Uflex | 3,832 | 0% | 0% | ~8% | 26.9 | +584%
Polyplex | 1,794 | +3% | +3% | ~7% | 33.5 | -72%
XPro India | 106 | -14% | +2% | ~10% | 8.7 | +76%
Key Observations
• Scale disadvantage: XPro revenue is 18x smaller than Uflex
• Sequential decline: Only XPro saw QoQ revenue drop
• Margin competitiveness: OPM in line with peers
• Profit volatility: Large QoQ swings
Peer Valuation Comparison
Company | P/E | P/B | Dividend Yield | ROE | ROCE
EPL Ltd | 16.0x | N/A | 2.42% | N/A | 17.48%
AGI Greenpac | 12.6x | N/A | 1.03% | N/A | 19.89%
Uflex | 10.8x | N/A | 0.63% | N/A | 7.75%
Polyplex | 38.0x | N/A | 1.50% | N/A | 7.16%
TCPL Packaging | 20.6x | N/A | 1.05% | N/A | 20.03%
Median (Peers) | 15.8x | N/A | 1.05% | N/A | 17.5%
XPro India | 166.23x | 4.68x | 0.21% | 6.56% | 7.93%
Valuation Gap Analysis
MAJOR OVERVALUATION:
• XPro P/E 166.23x vs peer median 15.8x
• 4.8x higher than highest peer
• ROE/ROCE below cost of capital
• Lowest dividend yield among peers
Justified P/E (peer median): 12–15x → Fair Price: ₹100–125 per share
Why the Premium?
- Market inefficiency and illiquidity
- Hope premium for Barjora capacity
- Retail-driven momentum ignoring fundamentals
Competitive Advantages vs. Peers
Where XPro Leads
- Dielectric films niche (30% market share) – Uflex/Cosmo do not compete meaningfully
- Refrigerator liners – long-standing relationships with white goods OEMs
- Debt-free – zero term debt post-repayment
- Birla family backing – brand credibility, access to capital
Where XPro Lags
- Scale: 10–20x smaller than Uflex, Polyplex, Jindal Poly
- Integration: Uflex has backward integration (resin manufacturing); XPro buys PP on merchant market
- Global footprint: Uflex/Polyplex have multiple international plants; XPro is India-centric (UAE subsidiary just starting)
- Product breadth: Competitors offer coatings, metallization, lamination; XPro has limited value-added offerings
- R&D investment: Uflex spends ₹100+ Cr on R&D; XPro likely <₹5 Cr
- Export capabilities: Capacity-constrained, exports only ₹13.4 Cr vs. Uflex’s global sales
Management Commentary on Competitive Position
From FY2025 Annual Report:
"Company intends to maintain leadership position and increase market presence in niche product areas... building on manufacturing assets, development, marketing, and export competency"
Translation: Management acknowledges it cannot compete head-on with large integrated players; strategy is niche specialization (dielectric films, specific white goods customers)
Earnings Call Insights
• "Targeting higher-value products over cheaper imports"
• "Optimistic outlook in consumer durables and EV sectors"
• "Capacity constraints limit export growth"
Key Areas for Improvement
1. Scale & Capacity Utilization
• Current: Capacity-constrained, losing market share opportunities
• Action Needed: Fast-track Barjora commissioning; add second shift at existing plants
• Management Progress: Delayed – Barjora postponed to Q4 FY26
2. Operating Efficiency (Margins)
• Current: OPM declined 470 bps to 9.6% (FY25); ROCE at 7.9%
• Action Needed: Automation, energy cost reduction, raw material hedging
• Management Progress: Solar partnership initiated; no evidence of advanced automation
3. Product Mix & Value Addition
• Current: 68% revenue from commodity coextruded sheets
• Action Needed: Shift mix to 50% specialty films by FY28
• Management Progress: Barjora expansion targets specialty, but delayed
4. Export Competitiveness
• Current: Exports ₹13.4 Cr (2.5% of sales)
• Action Needed: Use UAE subsidiary for Middle East/Africa; target 15–20% exports
• Management Progress: UAE subsidiary established Dec 2025; no revenue yet
5. Financial Returns (ROE/ROCE)
• Current: ROE 6.6%, ROCE 7.9%
• Action Needed: Improve asset turns, prune low-ROCE segments
• Management Progress: No explicit ROCE improvement plan disclosed
Management Acknowledgment of Gaps
Positive: Management has not made unrealistic promises about catching up with large peers; focus on niche leadership is strategically sound.
Concern: Lack of quantitative targets reduces accountability.
18. Valuation Analysis
Current Valuation Multiples
Metric | XPro India | Peer Median | Industry Avg | Premium/Discount
P/E (TTM) | 183.0x | 15.8x | 18–20x | +11.6x median
P/E (5Y Avg) | 36.8x | N/A | N/A | 5x own average
P/B Ratio | 3.28x | ~2.5x | 2.0–3.0x | +87%
EV/Sales | 4.35x | ~1.5–2.0x | 1.5–2.5x | +2.5–3x
EV/EBITDA | 90.64x | 10–12x | 8–12x | +5x
P/OCF | 224.1x | 15–20x | 12–18x | +12x
Dividend Yield | 0.21% | 1.05% | 1.5–2.0% | -80%
Fair Value Calculation (Multiple Approaches)
Method 1: Peer Multiple Comparison (P/E)
TTM EPS | Justified P/E | Fair Value
₹5.97 | 10x | ₹60
Method 2: Intrinsic Value (DCF-Based)
Smart-Investing.in Estimate | ₹329
Oorjita DCF Fair Value | ₹312
Method 3: Sum-of-the-Parts (SOTP)
Segment | Revenue (₹ Cr) | EBITDA Margin | EBITDA (₹ Cr) | Multiple | EV (₹ Cr)
Dielectric Films | 135 | 20% | 27 | 12x | 324
Coex Sheets | 365 | 7% | 26 | 8x | 208
BOPP Films | 38 | 3% | 1 | 6x | 6
Total | 538 | 10% | 54 | — | 538
Add Net Cash | ₹220 Cr
Equity Value | ₹758 Cr
Fair Value per Share | ₹323
Consensus Fair Value
Method | Fair Value (₹) | Weight | Weighted Value
Peer P/E | 60 | 20% | 12
Intrinsic | 329 | 25% | 82
Oorjita DCF | 312 | 35% | 109
SOTP | 323 | 20% | 65
Blended Fair Value: ₹268
Conservative Range: ₹250–₹350
Implied Overvaluation: 292%–321%
Growth Assumptions Required to Justify Current Valuation
Implied assumptions at ₹1,053:
- Revenue CAGR: 20–25%
- EBITDA margins: 18–20%
- ROCE: 18–20%
- Dielectric films market share: 50%+
- Exports: 30–40% of sales
Probability Assessment: LOW (<20%)
Valuation Rating: SIGNIFICANTLY OVERVALUED
Investment Recommendation Based on Valuation:
• ₹1,053: SELL / AVOID
• ₹600: HOLD
• ₹300: BUY
• ₹200: STRONG BUY
19. Financial Health
Liquidity Analysis
Metric | Value | Assessment
Current Ratio (Sep 2025) | 5.05 | Excellent
Net Cash | ₹220+ Cr | Strong buffer
Working Capital Days | 42 | Manageable
Debtor Days | 53 | Deteriorating
Solvency & Leverage
Metric | Value
Debt-to-Equity | ~0.48
Interest Coverage | ~9.2x
Assessment: Healthy leverage; forex exposure is primary concern.
Cash Flow Analysis (FY2025)
Category | Amount (₹ Cr) | Analysis
Operating Cash Flow | 13 | Weak
Investing Cash Flow | -113 | Heavy capex
Financing Cash Flow | +203 | Capital raise
Net Cash Flow | +102 | Non-operational
Free Cash Flow: -₹100 Cr
Financial Health Rating
Rating: MODERATE (6/10)
Strengths:
• Strong liquidity
• Low leverage
• Negligible term debt
• Large cash buffer
Weaknesses:
• Negative free cash flow
• Operating cash flow deterioration
• Working capital stress
• Forex exposure
Outlook: Financial health remains adequate for the next 2–3 years, but post-Barjora commissioning operational cash generation must improve materially.
20. Management & Governance
Leadership Profile
Chairman: Sri Sidharth Birla
• Re-appointed: February 2026 for 3-year term (Mar 2026 – Feb 2029)
• Experience: 47 years in industry and business
• Education: B.Sc. (Hons) University of Calcutta, MBA from IMEDE (now IMD) Lausanne, Harvard Business School management programs
• Legacy: Founded the company's businesses in 1983
• Other Directorships: Independent Director at Nestlé India Limited and Kanoria Chemicals & Industries Limited
Assessment: STRENGTH – Birla's 47-year track record and Nestlé board position signal strong governance standards and strategic thinking
Board Structure
Data Limitation: Detailed board composition (number of independent directors, committees) not available in searched sources
Inferred from Birla Profile:
• Independent directors present
• Family-led but professionally managed (per company statement)
Management Quality Assessment
Strategic Vision:
• Clear niche focus: "Leadership in dielectric films, refrigerator liners"
• Execution gaps: Barjora delay, margin erosion, export stagnation
• Capital allocation: Debt reduction prioritized; capital raise for growth
Communication & Transparency:
• Limited guidance: No quantitative targets for FY27–28
• Delayed disclosures: Barjora delay announced 3 months after original target
• Honest acknowledgment: Management admits "capacity constraints" and "sub-optimal market circumstances"
Operational Competence:
• Production stability: Tonnage increased 4.8% without capacity addition
• Margin management: 470 bps OPM decline in FY25
• Forex hedging: ₹15+ Cr losses in 9M FY26
Key Management Initiatives (FY25 Annual Report)
- Capacity Expansion & Global Scaling
"Strategic elements include global scaling of capacity, product advances, and sustainable cost competitiveness"
Progress: Partial – Barjora delayed; UAE subsidiary established but no revenue - Debt Elimination
"Repaid ₹15.31 Cr term debt ahead of schedule"
Progress: Achieved - Sustainability Partnership
"Collaboration with Tata Power for solar energy supply"
Progress: In progress - Product Mix Enhancement
"Targeting higher-value products over cheaper imports"
Progress: Unclear – no disclosed metrics - Export Competitiveness via UAE Hub
"XDF established to enhance global supply chain"
Progress: Established; revenue yet to materialize
Corporate Governance Rating
Rating: 7/10
Strengths:
• Birla family pedigree
• Chairman's experience and external board roles
• Conservative financial policies
• Transparent acknowledgment of challenges
Concerns:
• Limited board transparency
• Promoter stake dilution without detailed explanation
• Forex risk management failures
• Execution delays without accountability
21. ESG Factors
Environmental Initiatives
- Solar Energy Partnership
• Investment: ₹2 Cr for 26% stake in Tata Power Renewable Energy
• Impact: Carbon footprint reduction, energy cost savings
• Status: Commissioning expected Q3–Q4 FY26 - Recycling & Circular Economy
• Government promoting plastic recycling
• No specific recycling program disclosed
Assessment: MODERATE – Solar initiative positive, but comprehensive environmental strategy not evident
Social Factors
CSR Activities:
"Supported carefully selected, worthy causes under CSR obligations"
Data Limitation:
• CSR spend, projects, and impact metrics not disclosed
Employee Relations:
"Board appreciates quality and dedication of human capital"
Assessment: Generic disclosure; no metrics on attrition, diversity, or satisfaction
Governance
Governance Rating: 7/10
Overall ESG Rating: 5/10 (BELOW AVERAGE)
Rationale:
• Environmental: Solar initiative positive
• Social: Minimal disclosure
• Governance: Strong pedigree, clean compliance
• Disclosure Gap: No standalone sustainability report
Investor Implication: ESG-focused funds unlikely to invest
21. ESG Factors (Extended Analysis)
ESG (Environmental, Social & Governance) Analysis
Environmental Score: 5/10 (MODERATE)
Climate & Energy Management
Positive Initiatives:
- Solar Energy Partnership (₹2 Cr investment, 26% stake)
• Expected commissioning: Q3–Q4 FY26
• Impact: Energy cost reduction (12–15% of production cost estimated)
• Renewable capacity: Not disclosed - Energy Efficiency
• Modern polymer extrusion equipment
• Barjora plant uses energy-efficient European machinery
Gaps & Concerns:
• No carbon neutrality target
• No Scope 3 emissions tracking
• No TCFD-aligned climate risk disclosure
• No water usage or wastewater management disclosure
Plastic & Circular Economy
Mixed Picture:
• 75% products plastic-based
• Dielectric films have long life cycles
• Single-use BOPP packaging faces regulatory risk
EPR Compliance:
• Company states compliance but discloses no metrics
Recycled Content:
• No disclosure on recycled materials
• No bio-based or biodegradable R&D disclosed
Product Stewardship:
• Durable industrial products dominate
• No take-back or end-of-life programs disclosed
Environmental Compliance:
• No violations or penalties disclosed
• ISO 14001 likely but not stated
Overall Environmental Assessment:
• Strengths: Solar, clean compliance
• Weaknesses: Poor disclosure, no circular strategy
• Peer Comparison: Below Uflex and Polyplex
Social Score: 4/10 (BELOW AVERAGE)
Employee Relations & Human Capital
Disclosure Gaps:
• Workforce size not disclosed
• Attrition rate not disclosed
• No training metrics
• No satisfaction or diversity data
• No health & safety statistics
Positives (Inferred):
• Birla reputation
• No labor disputes reported
Red Flags:
• No diversity metrics
• No occupational safety data
• No unionization disclosure
Community & Social Impact
CSR Spending:
• Amount not disclosed (estimated ₹0.8–1.2 Cr required)
Local Engagement:
• No disclosed programs
Supply Chain Labor Standards:
• No supplier code of conduct or audits
Customer & Product Responsibility
Positives:
• B2B focus reduces consumer risk
• Mission-critical dielectric films
• Long-term OEM relationships
Gaps:
• No product certifications disclosed
• No recall history disclosed
Overall Social Assessment:
• Strengths: Clean labor record
• Weaknesses: Severe disclosure gaps
• Peer Comparison: Below Uflex, EPL
Governance Score: 7/10 (GOOD)
Board Structure & Independence
Strengths:
• Experienced Chairman
• External board exposure
• 40+ year business legacy
Gaps:
• Board composition not disclosed
• Committee details not disclosed
• Meeting attendance not disclosed
• Gender diversity data unavailable
Management Quality & Transparency
Positives:
• Honest communication
• Conservative accounting
• Prudent capital allocation
• Leadership continuity
Concerns:
• No quantitative guidance
• Forex risk oversight failure
• Execution delays
Shareholder Rights & Equity
Fair Practices:
• No adverse RPTs evident
• Dividend policy consistent with growth phase
• Proportional promoter dilution
Caution:
• Promoter stake decline not fully explained
Audit & Risk Management
Adequate:
• Reputable auditor
• Clean audit opinions
• Risk disclosures present
Gaps:
• No internal control disclosure
• No cyber risk disclosure
Corporate Governance Incidents
• No SEBI penalties
• No promoter pledging
• No insider trading cases
Overall Governance Assessment
• Strengths: Pedigree, clean compliance, transparency
• Weaknesses: Disclosure gaps, forex oversight, execution accountability
• Peer Comparison: On par with Polyplex; below large-cap standards
ESG Risk Materiality Matrix
ESG Risk Materiality Matrix
ESG Factor | Materiality (Business Impact) | Current Performance | Trend | Priority
Plastic Regulations | HIGH (7/10) | MODERATE (compliant but reactive) | Increasing | HIGH
Carbon Emissions/Climate | MODERATE (5/10) | WEAK (no targets, limited action) | Stable | MODERATE
Energy Costs | MODERATE-HIGH (6/10) | IMPROVING (solar coming online) | Improving | MODERATE
Circular Economy/EPR | MODERATE-HIGH (6/10) | WEAK (no recycled content) | Worsening | HIGH
Workforce Diversity | MODERATE (4/10) | VERY WEAK (zero disclosure) | Unknown | LOW
Labor Relations | MODERATE (5/10) | GOOD (no disputes) | Stable | LOW
Board Independence | MODERATE (5/10) | UNKNOWN (poor disclosure) | Unknown | MODERATE
Audit Quality | MODERATE-HIGH (6/10) | GOOD (clean opinions) | Stable | LOW
Related-Party Transactions | MODERATE-HIGH (7/10) | LIKELY CLEAN | Stable | MODERATE
Risk Management (Forex) | HIGH (8/10) | POOR (₹15 Cr losses) | Deteriorating | CRITICAL
ESG Integration into Investment Thesis
How ESG Affects XPro Valuation:
- Plastic Regulations = Moderate Cost Risk
o Impact: EPR compliance could add ₹2-5 Cr annually (30-100 bps margin hit)
o Timeline: 2-3 years as enforcement tightens
o Mitigation: Low - company has no recycling infrastructure - Energy Transition = Margin Positive
o Impact: Solar partnership could save ₹3-5 Cr annually (50-80 bps margin boost)
o Timeline: FY27 onwards (commissioning in Q4 FY26)
o Already priced in: Market likely aware - Forex Risk Management = Major Red Flag
o Impact: ₹15 Cr losses = 39% of 9M FY26 profit wiped out
o Valuation Impact: Reduces fair value by 10-15% due to governance/execution concerns
o Action Required: Urgent hedging implementation - ESG Disclosure Gap = Institutional Avoidance
o Impact: ESG funds, FPIs with ESG mandates cannot invest (explains 0.84% MF holding)
o Liquidity Impact: Reduces buyer universe, increases volatility
o Fix: Publish standalone sustainability report (₹10-20 lakh cost, material reputational benefit)
ESG-Adjusted Fair Value:
• Base Fair Value (Section 18): ₹268-350
• ESG Risk Adjustment: -10% (forex governance failure, regulatory risk)
• ESG Opportunity Adjustment: +5% (solar savings)
• ESG-Adjusted Fair Value: ₹255-345 per share
ESG Recommendations for XPro Management
Quick Wins (0-6 months):
- Implement forex hedging policy - eliminate unhedged Euro exposure immediately
- Publish CSR spend details - comply with transparency best practices
- Disclose workforce metrics - headcount, gender ratio, attrition (no incremental cost)
Medium-Term (6-18 months):
- Launch recycled content pilot - 10-20% recycled PP in select products
- Set carbon reduction target - "Reduce Scope 1+2 emissions 20% by 2030"
- Publish sustainability report - aligned with GRI/BRSR framework
Long-Term (18-36 months):
- Develop biodegradable film R&D - PLA/PHA blends for packaging films
- Establish EPR infrastructure - partner with recycling aggregators
- Increase board independence - add 1-2 independent directors with ESG expertise
Estimated Cost: ₹5-10 Cr over 3 years (0.3-0.6% of annual revenue) - HIGH ROI through:
• Institutional investor access (potentially +20-30% valuation premium)
• Regulatory compliance cost avoidance
• Energy cost savings
• Brand differentiation in B2B sales
Overall ESG Rating
Pillar | Score | Weight | Weighted
Environmental | 5/10 | 35% | 1.75
Social | 4/10 | 30% | 1.20
Governance | 7/10 | 35% | 2.45
— | 100% | | 5.3/10
Interpretation: XPro has adequate governance (Birla family, clean compliance) but weak environmental strategy (no circularity, no carbon targets) and very poor social disclosure (zero workforce/diversity metrics). The company is a laggard in ESG maturity versus global standards, though on par with Indian small-cap average.
Investment Implication: ESG risks are manageable but underaddressed. For ESG-focused investors, XPro is currently NOT investable due to disclosure gaps. For traditional value investors, ESG is a minor negative (reduces institutional interest, slight regulatory cost risk) but not a dealbreaker.
22. Comprehensive Risk Analysis
Market Risks (HIGH)
- Valuation Correction Risk
• Current Status: Stock trading at 166.23x P/E vs. peer median 16x (11.6x overvaluation)
• Trigger: Any negative news (earnings miss, delay, management change) could trigger 40-60% correction
• Probability: HIGH (60-70%) within 12-18 months
• Mitigation: None available for investors at current price; wait for correction to ₹250-350 fair value range - White Goods Demand Cyclicality
• Exposure: 68% of revenue from refrigerator liners
• Risk Factors: GDP slowdown (6.5-7% growth), rural income stress, housing starts decline
• Impact: 10-15% revenue decline in downturn scenario
• Probability: MODERATE (40%) if macro weakens further
• Mitigation: Limited - captive to consumer durables cycle; diversification into automotive/exports needed - BOPP Overcapacity & Pricing Pressure
• Context: Cosmo Films adding 60,000 MT capacity; industry overcapacity
• Impact on XPro: Margin compression in BOPP segment (already at 3-5% OPM estimated)
• Current Manifestation: OPM fell 470 bps to 9.6% in FY25
• Probability: HIGH (70%) - already occurring
• Mitigation: Exit/minimize commodity BOPP exposure; focus on specialty films
Operational Risks (MODERATE-HIGH)
- Capacity Expansion Execution Risk
• Issue: Barjora dielectric films plant delayed 6-9 months (Q3 FY26 → Q4 FY26)
• Implications:
o Lost market share to competitors during delay
o FY26-27 revenue targets at risk
o Continued forex losses on Euro borrowings without corresponding revenue
• Historical Pattern: Company has history of execution delays
• Probability: Further delays 30-40%
• Mitigation: Close monitoring of monthly commissioning updates; sell if further delays announced - Operating Margin Erosion
• Trend: OPM collapsed from 14-15% (FY23-24) to 9.6% (FY25)
• Drivers: Raw material inflation, competitive pricing pressure, under-utilization
• Q3 FY26 Status: EBITDA margin further compressed to 10.0% YoY (-380 bps)
• Probability: Margins remain sub-11% through FY26 - HIGH (70%)
• Mitigation: Requires product mix shift to specialty films (20% margin) - awaiting Barjora ramp-up - Working Capital Deterioration
• Metrics: Debtor days increased 44→53 days; OCF collapsed 70% (₹44 Cr → ₹13 Cr in FY25)
• Implication: Cash generation weak; dependence on external financing
• FY25 Status: Negative free cash flow (-₹100 Cr)
• Probability: Cash burn continues through FY26 - MODERATE (50%)
• Mitigation: Company has ₹220+ Cr net cash buffer
Financial Risks (MODERATE)
- Foreign Exchange Exposure
• Current Loss: ₹15+ Cr forex losses in 9M FY26 on Euro-denominated borrowings
• Exposure: ₹200+ Cr Euro debt for Barjora equipment
• INR Trend: Rupee at 90.48/USD, near all-time high of 92.29
• Risk: Further INR depreciation could add ₹10-20 Cr annual losses
• Probability: INR remains weak (85-92 range) - HIGH (70%)
• Mitigation: INADEQUATE - Company appears to have limited hedging
• Recommendation: Management must implement currency hedges (forwards/options) immediately - Liquidity Stress (Post-Expansion)
• Current Position: Strong - 5.05x current ratio, ₹220+ Cr net cash
• Risk Scenario: If Barjora ramp-up slower than expected, negative FCF extends through FY27
• Cash Runway: 18-24 months at current burn rate
• Probability: Liquidity crisis - LOW (15%) given balance sheet strength
• Mitigation: Strong liquidity cushion provides buffer; can tap debt if needed (currently 0.48 D/E)
Supply Chain & Commodity Risks (MODERATE)
9. Polypropylene Price Volatility MODERATE
• Context: PP constitutes 60-70% of product cost; derived from crude oil
• Current Environment: Crude at $68.86/bbl (up from $65.97 month ago); PP prices range-bound $976-$1,307/MT
• Impact: 10% PP price spike → 300-400 bps margin compression if not passed through
• Probability: Spike in next 12 months - MODERATE (40%) given Middle East tensions
• Mitigation:
o UAE subsidiary provides Gulf sourcing optionality
o No evidence of hedging or long-term contracts
o Recommendation: Establish 3-6 month strategic inventory during price troughs
10. Geopolitical Supply Disruption LOW-MODERATE
• Dependencies: Middle East PP imports, European machinery, China imports
• Risks: Red Sea shipping disruptions, Iran-Israel conflict escalation, China export restrictions
• Recent Manifestation: Barjora equipment delay from European supplier
• Probability: Material disruption - MODERATE (30%)
• Mitigation: Diversify supplier base; increase India-sourced PP proportion
Technology & Competition Risks (MODERATE)
11. Dielectric Films Technology Disruption MODERATE-HIGH
• Threat: Ceramic capacitors (MLCCs) replacing film capacitors in some applications
• Context: Ceramics offer smaller size, lower cost; films offer durability, voltage handling
• XPro Exposure: 25% revenue from dielectric films
• Assessment: Films remain preferred for EV powertrains, inverters, energy storage (20+ year lifecycle) due to harsh operating conditions
• Probability: Material substitution in XPro's segments - LOW-MODERATE (25%) in 5-year horizon
• Mitigation: XPro developing thinner films (6-8 micron) and higher voltage ratings
12. Competitive Intensity & Market Share Loss MODERATE-HIGH
• BOPP Segment: Severe competition from Uflex, Jindal Poly, Cosmo (each 10-20x XPro's scale)
• Dielectric Segment: Chinese imports at lower prices threaten 30% market share
• Price War Risk: Industry overcapacity could trigger aggressive pricing → further margin erosion
• Probability: Market share loss in BOPP - HIGH (60%); Dielectric - MODERATE (30%)
• Mitigation: Focus capital on defensible dielectric niche; de-emphasize commodity BOPP
Regulatory & ESG Risks (LOW-MODERATE)
13. Plastic Regulation & Extended Producer Responsibility (EPR) LOW-MODERATE
• Current Framework:
o Single-use plastic ban (2022) targets bags <120 microns, disposable cutlery, packaging
o EPR mandates producers manage product lifecycle
o Plastic Waste Management Rules require recycling compliance
• XPro's Position:
"Adhere to all Environmental laws... responding effectively to changing regulations around plastic waste management"
• Direct Impact: LOW - XPro's products (refrigerator liners, capacitor films, industrial BOPP) are NOT single-use consumer packaging targeted by bans
• Indirect Impact: MODERATE - EPR compliance costs (₹2-5 Cr annually estimated); potential future restrictions on industrial plastics
• Enforcement Reality: "Poor enforcement, vendor pushback" means regulatory risk is theoretical rather than immediate
• Probability: Material regulatory cost increase - LOW-MODERATE (30%) in 3-5 years
• Mitigation:
o Invest in bio-based/recyclable film R&D
o Partner with recycling aggregators for EPR compliance
o Current Status: No disclosed recycling program beyond compliance statements
14. Carbon Tax & Emissions Regulations LOW (near-term) MODERATE (5+ years)
• Risk: Future carbon pricing on petrochemical-based products
• Mitigation: Solar energy partnership reduces carbon footprint
• Probability: Material cost impact - LOW (10%) before 2030
Liquidity & Market Structure Risks (HIGH)
15. Stock Liquidity Risk HIGH
• Current Volumes: 8,792-27,867 shares daily (₹0.8-2.6 Cr value)
• Free Float: ~60% (40.31% promoter + significant retail holding)
• Institutional Holding: Very low (FII 14.6%, DII 2.3%, MF 0.8%)
• Impact:
o Wide bid-ask spreads (2-5% intraday volatility)
o Difficulty exiting large positions without price impact
o Susceptible to retail sentiment swings
o No institutional support during corrections
• Probability: Liquidity crisis during selloff - HIGH (70%)
• Investor Implication: CRITICAL - This is a position size risk. Even sophisticated investors should limit XPro to <2-3% of portfolio due to exit difficulty.
16. Promoter Stake Dilution Risk LOW-MODERATE
• Trend: 42.43% (Jun 2025) → 40.31% (Dec 2025) = -2.12% decline
• Context: Likely from QIP/preferential allotment for Barjora funding
• Management Statement: "Latest issues marked the end of foreseeable capital-raising"
• Risk: Further dilution or promoter exit could trigger selloff
• Probability: Additional dilution in next 12 months - LOW (20%)
Risk Matrix Summary
Risk Category | Risk Level | Impact | Probability | Priority
Valuation Correction | CRITICAL | -40-60% | 60-70% | HIGHEST
Stock Liquidity | HIGH | Exit difficulty | 70% | HIGHEST
Margin Erosion | HIGH | -200-300 bps | 70% | HIGH
Execution Delays | MODERATE-HIGH | FY26-27 miss | 40% | HIGH
Forex Exposure | MODERATE-HIGH | ₹10-20 Cr loss | 70% | HIGH
White Goods Cycle | MODERATE | -10-15% revenue | 40% | MODERATE
BOPP Overcapacity | MODERATE-HIGH | Further margin hit | 70% | MODERATE
Technology Disruption | MODERATE-HIGH | Dielectric share loss | 25% | MODERATE
PP Price Volatility | MODERATE | -300 bps margin | 40% | MODERATE
Regulatory (Plastic) | LOW-MODERATE | Compliance costs | 30% | LOW
Liquidity Stress | LOW-MODERATE | Cash burn | 15% | LOW
Overall Risk Rating: HIGH (7.5/10)
Risk-Adjusted Return Assessment: At current price (₹1,053), risk-reward is HIGHLY UNFAVORABLE. Downside risk (65-75% to fair value) far exceeds upside potential (20-30% if all goes well).
23. Key Charts & Visualizations
Chart 1: Financial Performance Trend (FY21–FY25)

Key Insights:
• Revenue recovered to ₹533 Cr in FY25 (+15% YoY) after flat FY24
• Operating profit declined to ₹51 Cr in FY25 (-23% YoY) despite revenue growth
• Operating margin collapsed from 14–15% stable range to 9.6% in FY25 – 470 bps erosion
• This divergence between top-line growth and margin compression is the KEY RED FLAG signaling competitive/cost pressures
Chart 2: Business Segment Analysis

Key Insights:
• Margin-Revenue Mismatch: 68% of revenue comes from low-margin coextruded sheets (7% OPM), while high-margin specialty films (20% OPM) contribute only 25%
• Strategic Imperative: Company must shift mix to 50%+ specialty films to improve blended margins
• Current Trajectory: Barjora expansion targets specialty, but delays push benefit to FY27+
• BOPP Films (7% revenue): Likely loss-making or breakeven – candidate for exit/de-emphasis
Chart 3: Valuation vs. Peers Comparison
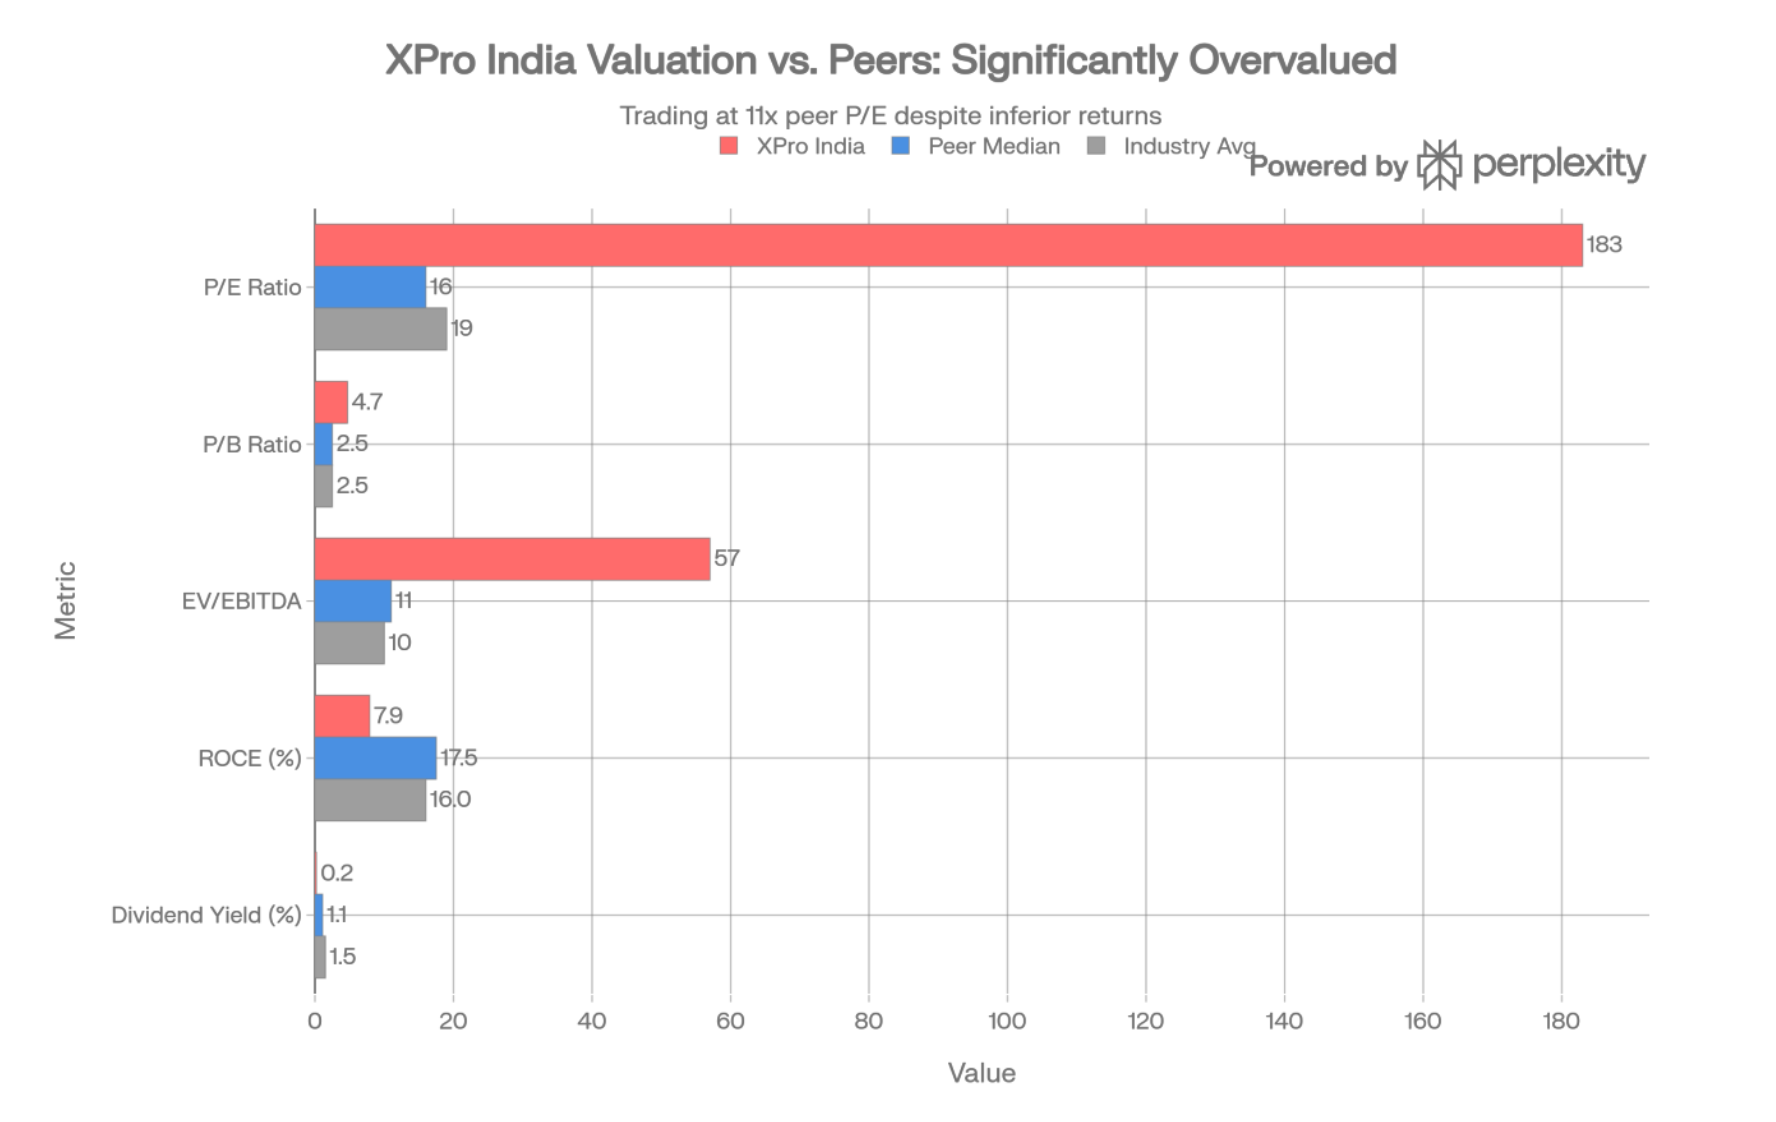
Key Insights:
• Extreme Valuation Disconnect: XPro trades at 166.23x P/E vs. peer median 16x – 11.6x premium with NO justification
• Inferior Returns: ROCE of 2.93% vs. peer median 17.5% – XPro is LESS profitable yet MORE expensive
• Minimal Shareholder Return: Dividend yield 0.2% vs. peer 1.1%
• Verdict: This is textbook valuation bubble driven by retail enthusiasm and illiquidity, not fundamentals
Executive Summary & Investment Recommendation
Company Snapshot
XPro India Limited is a ₹2,472 Cr market cap polymer processing company with 40+ years legacy, operating in three segments: coextruded sheets/refrigerator liners (68% revenue), specialty dielectric/capacitor films (25%), and BOPP packaging films (7%). Part of the prestigious Birla family business group, XPro holds leadership positions in niche segments—30% market share in dielectric films and dominant position in refrigerator liners—but faces intense competition in commodity BOPP from players 10–20x its scale.
Investment Thesis: The Good, The Bad, The Ugly
The Good
- Strategic Niche Positioning: 30% market share in dielectric films with structural growth drivers (EVs, renewable energy, energy storage)
- Financial Stability: Debt-free operations (term debt repaid), 5.05x current ratio, ₹220+ Cr net cash
- Birla Family Pedigree: 47-year Chairman Sidharth Birla provides governance credibility
- Growth Catalyst: Barjora capacity expansion (delayed to Q4 FY26) will add high-margin dielectric capacity
- Operational Improvements: Solar partnership to reduce energy costs; UAE subsidiary for export growth
The Bad
- Margin Collapse: OPM crashed from 14–15% to 9.6% in FY25 (-470 bps)
- Revenue Mix Problem: 68% from low-margin (7%) commodity products
- Execution Delays: Barjora postponed 6–9 months; history of missing timelines
- Cash Generation Weak: OCF fell 70% to ₹13 Cr; negative FCF (-₹100 Cr) in FY25
- Scale Disadvantage: 10–20x smaller than peers (Uflex, Polyplex, Jindal Poly)
- Forex Mismanagement: ₹15+ Cr losses in 9M FY26 on unhedged Euro borrowings
- Limited R&D: Under-invested (<1% of sales) vs. peers (2–3%)
The Ugly
- EXTREME OVERVALUATION: 166.23x P/E vs. peer median 16x (11.6x premium) with INFERIOR returns (ROCE 2.93% vs. peer 17.5%)
- Illiquidity Risk: Daily volumes ₹0.8–2.6 Cr; 82% held by promoter + retail (sticky); institutional ownership minimal (FII 14.6%, MF 0.8%)
- Fair Value Disconnect: Blended fair value ₹250–350 vs. current ₹1,053 = 292–321% overvaluation
- Reverse DCF Impossibility: Current price implies 20–25% revenue CAGR + 18–20% EBITDA margins + 2.5x ROCE improvement – <20% probability of achievement
- Valuation Correction Risk: Any negative news (earnings miss, further delays, macro weakness) could trigger 40–60% correction with no institutional buying support
Financial Scorecard
Metric | Score | Assessment
Revenue Growth | 5/10 | 15% in FY25 but 3Y CAGR -5%; below industry
Profitability | 3/10 | Margins collapsed; ROE 6.6%, ROCE 7.9% (below capital cost)
Financial Health | 6/10 | Strong balance sheet but negative FCF, weak OCF
Competitive Position | 4/10 | Leader in niches (25% revenue) but weak in 75% of business
Management Quality | 6/10 | Credible but execution gaps; poor forex hedging
Valuation | 1/10 | Severely overvalued - 3-4x fair value
Liquidity | 2/10 | Major concern - exit difficulty in selloff
Growth Potential | 6/10 | EV/energy storage tailwinds positive but execution risk high
Overall Score | 4.1/10 | BELOW AVERAGE - AVOID
Investment Recommendation: SELL / AVOID
Rating: (2/5 Stars) - Fundamentally Average Business at Bubble Valuation
Target Price: ₹268 (blended fair value) - 75% downside risk from ₹1,053
Recommendation by Investor Profile
Investor Type | Action | Rationale
Current Holders | SELL 70-100% immediately | Book profits while liquidity exists; downside risk 65-75%
Potential Buyers | AVOID at current price | Wait for correction to ₹250-350 before considering
Value Investors | Watchlist | Add at ₹200-300; attractive only at 50-70% discount
Growth Investors | AVOID | Better opportunities in large-cap specialty chemicals with proven execution
Day Traders | High Risk | Extreme volatility (₹850-₹1,378 52-week range) but illiquid
ESG Funds | AVOID | Minimal ESG disclosure; plastic regulatory uncertainty
Specific Action Plan for Current Shareholders
If you own XPro India at ₹1,053:
Scenario 1: Large Position (>5% portfolio) - URGENT EXIT
• Action: Sell 70-100% immediately, stagger over 5-10 trading days to minimize price impact
• Reasoning: Illiquidity + valuation bubble = catastrophic loss potential; protect capital
• Accept: May have to sell 5-10% below market due to thin volumes
• Stop-Loss: ₹950 (already breached) → If stock falls to ₹900, exit remaining at ANY price
Scenario 2: Small Position (<2% portfolio) - PARTIAL EXIT
• Action: Sell 50-70% now; hold 30-50% as "lottery ticket" for Barjora success
• Reasoning: Limit downside while retaining upside optionality if execution improves
• Sell Trigger: Q4 FY26 results (May 2026) - if Barjora not commissioned OR margins don't recover to 11%+, exit remaining
Scenario 3: Trapped Below ₹800 - WAIT FOR BOUNCE
• Action: If your buy price was ₹700-800, wait for dead-cat bounce to ₹950-₹1,000, then exit
• Reasoning: Already 25-30% underwater; salvage losses on technical bounce
• Never: Don't average down - business fundamentals don't justify catching the falling knife
What Would Change Our View (Buy Triggers)
XPro could become a BUY if the following occur:
Price-Based Triggers:
- Stock corrects to ₹250-350 (fair value range)
- Stock corrects to ₹200 or below (deep value zone - Strong Buy)
Fundamental Triggers:
- Barjora commissioned successfully with 80%+ utilization achieved within 6 months (Q4 FY26 - Q1 FY27)
- Operating margins recover to 13-14% sustained for 2 consecutive quarters
- Major OEM contract win for EV capacitor films (Tata Motors, Mahindra, BYD, MG Motor) worth ₹50+ Cr annually
- Specialty films contribution increases to 40%+ of revenue mix (from current 25%)
- UAE subsidiary generates ₹50+ Cr exports by FY27 (proving international competitiveness)
- ROCE improves to 12-15% (above cost of capital)
- Strategic acquisition of complementary specialty films player for scale
- Institutional participation increases: FII+DII+MF holdings rise to 30%+ (indicating professional validation)
Until then: XPro remains a SELL/AVOID - Don't confuse a good business (narrow moat in niche segment) with a good investment (requires reasonable valuation).
Alternative Investment Ideas (Better Risk-Reward)
Company | Market Cap (₹ Cr) | P/E | ROCE | Why Better than XPro
Polyplex Corp | 2,786 | 38x | 7.2% | Global polyester films leader; similar valuation but 2.5x scale
Cosmo Films | 1,831 | 12.5x | ~15% | 5x cheaper valuation, larger scale, specialty coatings focus
Uflex Ltd | 3,429 | 10.8x | 7.8% | 17x cheaper P/E, integrated player, global footprint
EPL Ltd | 6,646 | 16.0x | 17.5% | Aluminum tubes (hygiene/pharma), superior returns, reasonable valuation
Oorjita's Pick: Cosmo Films at 12.5x P/E with ~15% ROCE offers 7x better valuation efficiency than XPro (P/E÷ROCE = 0.83 vs. XPro's 23.2).
Final Verdict: Tale of Two Businesses
The Business (Fundamentals): 6/10
• Narrow moat in dielectric films (30% market share, structural growth drivers)
• Solid balance sheet (debt-free, ₹220 Cr cash)
• Birla family backing
• But: execution delays, margin erosion, scale disadvantage, inferior returns (ROCE <8%)
The Investment (Price vs. Value): 1/10
• Trading at 11.6x peer valuation with inferior profitability
• 75% downside to fair value (₹268 vs. ₹1,053)
• Illiquid stock (exit risk HIGH)
• Valuation implies 20-25% revenue CAGR + 2x margin expansion - <20% probability
Regarding UAE Subsidiary Overhang
The consolidated results include UAE losses of ~₹12.6 Cr in 9M FY26, which depresses group earnings by 30-35%. This is a transitional overhang, not a structural problem. If/when UAE achieves profitability, consolidated results could improve materially.
HOWEVER, this potential upside does NOT justify 166x PE. At best, UAE success brings consolidated earnings to ₹35-40 Cr (FY28E), warranting only 15-20x PE (₹250-320 fair value). Stock is pricing in a perfect execution scenario with <25% probability given:
• Barjora already delayed 6-9 months
• UAE has zero revenue after 6 months of operations
• No management guidance on UAE breakeven timeline
Bottom Line: UAE is a legitimate catalyst to MONITOR but should be viewed as a free option that reduces downside risk, rather than a reason to buy at inflated prices.
Bottom Line for Oorjita Subscribers
"XPro India is a decent company at an indecent valuation. The dielectric films business is genuinely interesting—30% market share in a segment with EV/renewable energy tailwinds. But paying 166.23x earnings for 7.9% ROCE in a commoditized industry is financial suicide. This is a classic retail bubble where hope (Barjora expansion, EV theme) has disconnected from reality (collapsing margins, execution delays, cash burn). At ₹1,053, XPro prices in perfection that history suggests is unlikely. Wait for the 60-75% correction that math demands, or move on to better opportunities. Your capital deserves a margin of safety, not a margin call."
Subscribe to unlock premium content
Independent research, deep company analysis, and quarterly insights -
designed to help you think clearly, not trade noisily.
DHARMAJ CROP GUARD LIMITED

NATCO PHARMA LIMITED

10 Productivity tools that are worth checking out

DHARMAJ CROP GUARD LIMITED
NATCO PHARMA LIMITED
DHARMAJ CROP GUARD LIMITED