Mankind Pharma: India's No. 4 Drugmaker, Down 13.5%, Lags Peers on Profitability
Mankind Pharma is India’s 4th largest pharmaceutical company by domestic market value, with a diversified presence across prescription pharmaceuticals, consumer healthcare/OTC, and exports.
MK
Dr. Murali KalyanaramanGlobal CFO · 30+ years in corporate finance · Chartered Accountant (ICAI) · 87 min read
This research is for information and education only and is not investment advice. Figures may be provisional. Oorjita.AI and its authors may hold positions in securities mentioned. Please consult a SEBI-registered investment adviser before making investment decisions. Published Friday, 21 November 2025, 3:31 PM IST.
Mankind Pharma is India’s 4th largest pharmaceutical company by domestic market value, with a diversified presence across prescription pharmaceuticals, consumer healthcare/OTC, and exports. Its core business is domestic formulations (84% of FY24 revenue), spanning 27+ therapeutic areas, with a strategic focus on chronic therapies (diabetes, cardiology, neurology) now making up 37% of domestic sales. The company’s consumer healthcare brands (Manforce, Prega News, Gas-O-Fast) are market leaders in their segments. The 2025 acquisition of Bharat Serums & Vaccines (BSV) has positioned Mankind as the leader in Indian fertility and women’s health, with a portfolio of high-barrier biologics and biosimilars. The company’s total addressable market is robust, with strong growth prospects in chronic therapies, fertility, and OTC, and a clear ambition to expand exports and increase OTC’s revenue share. Read More
2. #Market-Positioning
Mankind Pharma holds a strong #4 position in the Indian pharmaceutical market by value, but is #1 in prescription share for eight consecutive years, reflecting deep doctor engagement and brand equity. Its chronic therapy segment is growing faster than the industry, while the acute segment faces commoditization and price pressure. The company is now the market leader in women’s health and fertility after the BSV acquisition, with an estimated 20–25% share in the fertility segment. In consumer healthcare, Mankind is among the top 10 OTC players, with brands like Manforce and Prega News enjoying strong recall. However, the company’s net margins and return ratios lag behind top peers, and it faces challenges from higher employee and finance costs, as well as premium valuation compared to industry averages. Read More
3. #Business-Moats-Competitive-Advantages
Mankind’s most defensible moats are its extensive rural and semi-urban distribution network, cost leadership in select segments, and a strategic shift toward chronic therapies. The BSV acquisition has created a near-unassailable position in women’s health and fertility, with high entry barriers in biologics and biosimilars. The company’s R&D capabilities are growing, with 6 centers and 241 patents, but R&D spend remains low compared to global peers. Manufacturing quality is robust, with WHO-GMP and USFDA-compliant facilities, but is considered a “table stakes” moat in pharma. Overall, Mankind’s competitive advantages are durable in distribution and women’s health, but moderate in cost leadership and R&D, and weakest in manufacturing quality, which is not a differentiator unless competitors falter.
Read More
4. #Moat-Rating--Competitive-Advantage-Score
Mankind’s overall moat strength is rated “Moderate to Strong” (67.3% or 3.5/5 stars). The company scores highest in women’s health/fertility (9/10) and distribution network (8/10), both with long-term durability and high barriers to entry. Chronic therapy focus (7/10) is a developing moat, while cost leadership (6.5/10) and R&D (6/10) are moderate. Manufacturing quality (5/10) is essential but not a unique advantage. The weighted scoring methodology considers strength, durability, and uniqueness, with the company’s strongest moats expected to remain defensible for 7–10 years. However, risks include price controls, API import dependency, and intensifying competition. Compared to peers, Mankind’s moats are stronger than mid-tier players but weaker than Sun Pharma, Cipla, and Dr. Reddy’s. Read More
5. #Recent-Quarterly-Performance-Q2-FY2026
In Q2 FY26, Mankind Pharma reported total revenue of ₹3,789 crore (+18.9% YoY), but net profit (PAT) declined 21.1% YoY to ₹520 crore, marking the fourth consecutive quarter of profit decline. EBITDA margin improved sequentially to 27.4% but remains below historical levels. The main drivers of margin compression are BSV integration costs, higher employee and finance costs, and supply chain disruptions from GST changes and uneven monsoon. While export revenue surged (+83% YoY, driven by BSV), domestic organic growth lagged the industry (6% vs. IPM 7.2%). The OTC segment declined 3% YoY due to supply chain issues. Despite these challenges, sequential trends are positive, with PAT up 17% QoQ and management expecting recovery in H2 FY26. Read More
6. #Annual-Performance-FY2024--FY2025-Trends
Mankind’s FY24 revenue grew 19% to ₹12,207 crore, outpacing the Indian pharma market’s 8% growth. The company has maintained double-digit revenue growth for five years, driven by volume expansion and market share gains. However, profitability metrics have deteriorated: PAT margin fell to 18.86%, ROE dropped from 23.14% to 16.98%, and ROCE from 28.35% to 17.05%. The current ratio declined sharply from 3.45 to 1.15, and the debt-to-equity ratio spiked to 0.50 post-BSV acquisition. While cash generation remains strong, the company’s financial flexibility is constrained by higher leverage and tighter liquidity. Compared to peers, Mankind leads in revenue growth but lags in margins, capital efficiency, and liquidity. Read More
7. #Strategic-Investments--Execution
The ₹13,630 crore acquisition of Bharat Serums & Vaccines (BSV) is Mankind’s most significant strategic move, making it the leader in Indian fertility and women’s health. The integration is on track, with export growth exceeding expectations, but synergy realization is slower than promised and margin dilution has occurred. Other strategic actions include restructuring the OTC business, expanding manufacturing capacity, and investing in R&D and digital infrastructure. Execution quality is above average, with disciplined capex and successful product launches, but concerns remain about delayed synergies, domestic growth lagging the industry, and four consecutive quarters of profit decline. Management’s “say-to-do” ratio is rated moderate, with key milestones achieved but some promises delayed. Read More
8. #Raw-Materials--Supply-Chain-Advantages
Mankind’s supply chain strengths include low inventory (3.22% of revenue) and freight costs (0.73%), partial backward integration (42 APIs produced in-house), and strong procurement relationships. The company sources most raw materials domestically, reducing forex risk and lead times, and owns packing material production units for cost efficiency. However, it remains dependent on China for 60–70% of APIs, exposing it to price volatility and supply disruptions. While inventory efficiency and procurement scale provide a cost advantage of ₹450–550 crore annually, the lack of exclusive supply contracts and limited API self-sufficiency (only 42 out of 300+ molecules) are vulnerabilities. Read More
9. #Supply-Chain-Dependencies--Geopolitical-Risks
Mankind’s critical dependency on China for APIs (60–70%) and intermediates (70–80%) is a major structural risk. Industry-wide, 70–80% of India’s API imports come from China, and Mankind’s exposure is estimated at similar levels. Disruptions from border tensions, trade restrictions, or environmental crackdowns in China could lead to 20–30% API price increases and production halts for key formulations. The company’s low inventory buffers (45–60 days) provide minimal protection against extended supply shocks. While government initiatives like the PLI scheme and bulk drug parks aim to reduce dependency,
10. #Raw-Material-Shortage-Risks
Mankind faces moderate-to-high risks from raw material shortages, primarily due to regulatory changes and trade disruptions affecting China-sourced APIs. Weather and disease-related risks are minimal, given the company’s focus on synthetic APIs. Regulatory actions, such as environmental crackdowns in China or India, could spike API prices by 20–30%. Trade bans or export restrictions, as seen during COVID-19, could halt exports and create domestic shortages. Single-source API dependencies for niche molecules also pose a risk. Mitigation strategies include multi-supplier relationships, strategic inventory buffers, and expanding in-house API production, but gaps remain in long-term supply contracts and geographic diversification. Read More
11. #Industry-Specific-Sales-Risks
Key risks for Mankind include expansion of price controls (NLEM), acute therapy commoditization, generic competition, and digital health disruption. About 30–35% of revenue is under NLEM price controls, limiting margin recovery. Acute therapies (63% of domestic revenue) face intense competition and price erosion, while chronic therapies offer more stability. Economic slowdowns, regulatory changes, and e-pharmacy growth could further pressure margins and sales. The company’s chronic therapy pivot and rural focus provide some mitigation, but margin and growth pressures remain. The overall industry sales risk rating is moderate-high (6.8/10), with NLEM expansion and acute therapy commoditization as the highest risks. Read More
12. #Research-Technology--Intellectual-Property
Mankind’s R&D spend is low (1.65% of revenue) compared to peers (6–8%), limiting innovation velocity. The company operates six R&D centers, has filed 241 patents (84% active), and 60+ US ANDAs, with 45 approved. The pipeline includes two novel chemical entities (NCEs) in early-stage development and a focus on complex generics and biosimilars post-BSV. While the patent portfolio is adequate for a generics-focused business, it lacks differentiation. R&D is not a near-term growth driver, but the US generics pipeline could add ₹500–700 crore revenue by FY28. Long-term, NCE success is critical for sustained differentiation, but commercialization is 7–10 years away. Read More
13. #Segment-Analysis
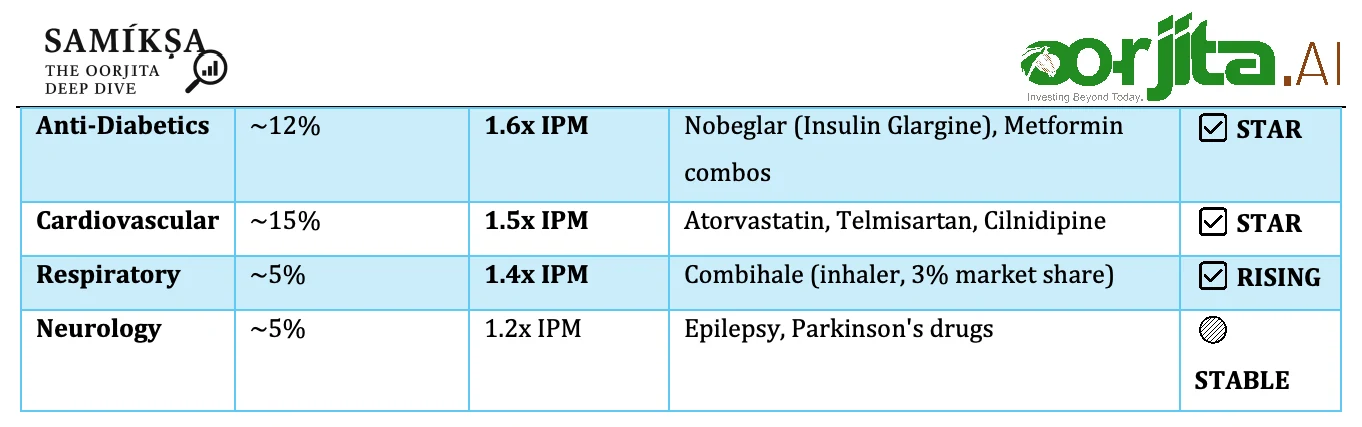
Domestic formulations remain Mankind’s core business (84% of revenue), but acute therapies (63% of domestic revenue) are underperforming the market, growing at only 0.8–0.9x the industry rate. Chronic therapies (37% of domestic revenue) are growing 1.4–1.6x faster than the market, driven by diabetes and cardiology. Exports (10–15% of revenue) are growing post-BSV, with significant potential in the US and Europe. The OTC/consumer healthcare segment (6–7% of revenue) is recovering from short-term disruptions, while women’s health/fertility (post-BSV) is an emerging, high-margin segment. Key risks include acute therapy commoditization, OTC sales divergence, and slow US ANDA commercialization. Read More
14. #Shareholding-Pattern-Changes
As of September 2025, promoter holding remains high at 72.67% (with 0% pledge), though it has declined due to equity issuance for the BSV acquisition. Mutual funds have increased their stake to 7.78%, while FIIs and insurance companies have reduced exposure, reflecting mixed institutional sentiment. The number of mutual fund schemes holding the stock is moderate (32), indicating some concentration risk. FII selling is attributed to margin compression, slow synergy realization, and premium valuation. Insurance company exits signal concerns about earnings stability. Overall, domestic institutional support is offsetting foreign exits, but the narrow institutional base is a concern. Read More
15. #Brokerage-Recommendations
Broker consensus is mixed: 60–65% “Buy,” 30–35% “Hold,” and 5–10% “Sell.” Target prices range from ₹2,100 to ₹2,800, with an average upside of 18%. Bullish arguments focus on BSV synergies, chronic therapy growth, and valuation correction. Bearish views cite margin compression, slow synergy realization, and domestic growth lagging the industry. Technical analysis suggests a bearish-to-neutral short-term outlook, with potential for a bounce if Q3/Q4 results exceed expectations. The consensus is to “Reduce/Sell” for new investors, “Hold” for existing investors with a stop-loss, and “Avoid” new entries until a correction or clear evidence of margin recovery. Read More
16. #Technical-Analysis-Share-Price-Trends
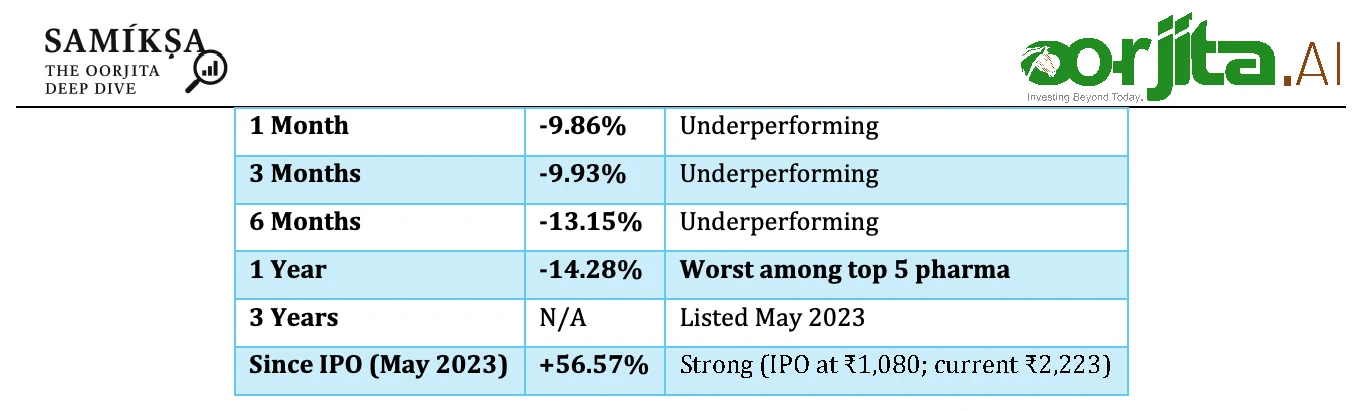
Mankind Pharma’s stock is in a bearish trend, trading below all key short- and medium-term moving averages. The current price is near strong support at ₹2,200, with a critical support at ₹2,115 (52-week low). Technical indicators (RSI, MACD, CCI) suggest weak momentum but not yet oversold, while stochastic indicators hint at a potential short-term bounce. The medium-term outlook is cautiously bullish if margins recover and BSV synergies materialize. The consensus is for a range-bound movement between ₹2,150–2,350 in the near term, with a breakout above ₹2,450 needed for a reversal. Read More
17. #Competition-Analysis
Mankind leads in prescription share and rural reach but lags top peers (Sun, Cipla, Dr. Reddy’s) in margins, US presence, and global scale. Its valuation premium is not justified by current profitability. The company’s strongest advantages are in rural distribution, chronic therapy growth, and women’s health leadership post-BSV. However, it faces critical gaps in margin expansion, US market penetration, and acute therapy performance. The competitive landscape is evolving, with threats from e-pharmacy disruption, generic competition, and potential market share loss to larger peers. Read More
18. #Valuation
Mankind trades at a significant premium (PE 52x vs. peer average 26x). DCF and peer-based fair value estimates suggest the stock is 30–50% overvalued, with a base case fair value of ₹1,200–1,400. Upside is limited unless margins recover and BSV synergies are realized. The risk-reward ratio is unfavorable (1:2.7), with potential downside of 37–46% in base/bear scenarios. Dividend yield is negligible, and the company’s premium valuation requires aggressive growth and margin expansion assumptions, which have a low probability of materializing. Read More
19. #Final-Investment-Recommendation
Mankind Pharma is a fundamentally strong business with defensible moats in rural distribution and women’s health, but the stock is overvalued at current levels. The recommendation is “Reduce/Sell for new investors,” “Hold” for existing investors with a stop-loss at ₹2,100, and “Avoid” new entries until a 30–40% correction or clear evidence of margin recovery and synergy realization. Key catalysts to monitor include margin recovery above 28%, BSV synergy announcements, and chronic therapy share reaching 42%+. The risk-adjusted return profile is negative, with asymmetric downside risk at current valuation. Read More
Part 1: Business Fundamentals & Performance Analysis
1Business Overview & Market Potential
Core Business Activities
Mankind Pharma Limited is India's 4th largest pharmaceutical company by domestic market value, operating as an integrated pharmaceutical and consumer healthcare enterprise. Established in 1995 by first-generation entrepreneurs Ramesh and Rajeev Juneja, the company has evolved into a diversified healthcare conglomerate with distinct competitive positioning.
Primary Business Segments:
Domestic Formulations (84% of FY24 revenue, 82% in 9M FY25):
Prescription pharmaceuticals across 27+ therapeutic areas
Chronic therapies: Diabetes, Cardiology, Neurology, Respiratory (37.1% of domestic business)
Volume-based model: Company philosophy of affordable pricing limits margin expansion
Lower net margins (18.86%) vs. peers indicate limited pricing leverage
Recent Pricing Actions:
Advertising spend increased 25% to ₹755 crores in FY25, suggesting need to invest in brand pull vs. pricing push
Secondary sales growth of 6.3% (below IPM 7.2%) indicates pricing challenges in acute segment
3Business Moats (competitive Advantages)
Moat #1: Distribution Network & Market Reach
Description:
Mankind operates one of India's most extensive pharmaceutical distribution networks, with company- owned distribution infrastructure and unparalleled reach into rural/semi-urban markets.
Key Components:
10,000+ medical representatives covering 8 lakh+ doctors
Highest coverage in Tier II-IV cities where 50%+ of India's population resides
Company-owned distribution setup (vs. third-party distributors used by peers)
43.5 billion units installed capacity to support volume growth
Durability: HIGH (7-8 years to replicate)
Building comparable distribution reach would require 7-10 years of sustained investment and relationship-building with doctors/stockists in remote areas.
Uniqueness: STRONG
Few competitors match Mankind's rural penetration depth. Sun Pharma has broader portfolio but weaker rural focus.
Mankind's founding principle centers on being a "price disruptor" delivering affordable medication without compromising quality.
Cost Advantage Sources:
Low marketing spend per revenue unit (Tier II-IV cities require less media expense than metros)
High-volume, low-margin model evidenced by 6.0% volume share vs. 4.8% value share
Inventory efficiency: Lowest inventory cost at 3.22% vs. Cipla's 7.88%
Freight cost advantage:0.73% vs. Dr. Reddy's 2.41%
Competitive Impact:
Enables penetration of price-sensitive markets and defends against generic competition in acute therapies.
Durability: MODERATE (3-5 years)
Cost advantages can erode as competitors optimize operations. However, company culture of frugality is difficult to replicate.
Moat Strength Rating: 6.5/10
Moat #3: Chronic Therapy Portfolio Shift
Description:
Strategic pivot toward chronic therapies (diabetes, cardiology, neurology) creates recurring revenue streams with higher margins and lower price sensitivity.
Evidence:
Chronic share increased to 37.1% from 35.1% YoY
• 160 bps increase in chronic prescription share in FY24
Growing at 9-10% CAGR vs. IPM 7-8%
Defensibility:
Doctor relationships built over years in chronic therapies are "sticky"
Patient switching costs high due to therapy continuity requirements
Higher R&D investment in chronic formulations creates lead time vs. competitors
Moat Strength Rating: 7/10
Moat #4: Women's Health & Fertility Leadership (Post-BSV Acquisition)
Description:
The ₹13,630 crore acquisition of Bharat Serums and Vaccines (BSV) completed in February 2025 catapults Mankind to market leadership in India's fertility and women's health segment.
Competitive Advantages:
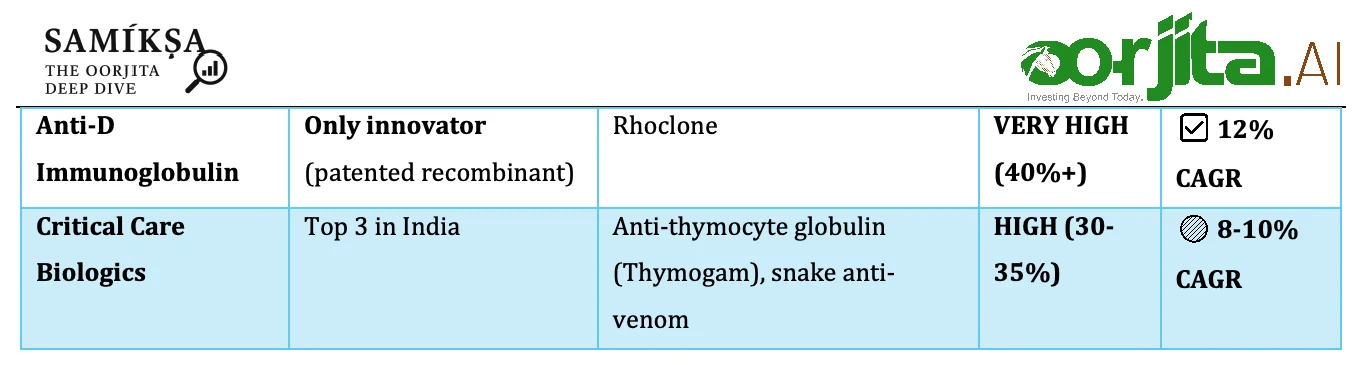
Only innovator worldwide to develop patented recombinant Anti-D
12 out of 15 top fertility drugs in portfolio (largest among peers)
High entry barriers: Complex biologics/biosimilars need 5-10 years R&D to develop
Regulated biologics business: Critical care immunoglobulins, anti-thymocyte products
Market Dynamics:
Rising infertility driven by lifestyle changes, delayed parenthood, chronic diseases
Growing at 12-15% CAGR with limited competition
Durability: VERY HIGH (10+ years)
Biologics and biosimilars have extremely high replication barriers due to R&D complexity, regulatory hurdles, and capital requirements.
Moat Strength Rating: 9/10
Moat #5: R&D Capabilities & Patent Portfolio
Description:
Mankind operates 6 R&D centers across India with ₹223 crores invested in FY24.
Innovation Pipeline:
300+ filed patents for innovative ideas
60+ filed ANDAs for US market regulatory approval
2 Novel Chemical Entities (NCEs) in preclinical stage (autoimmune, oncology)
GPR119 agonist for diabetes: Phase 1 complete, entering Phase 2
NASH molecule: Applied for Phase 3 clinical trial approval
2 US-ANDAs approved with CGT exclusivity (Phenylephrine solutions)
Recent Licensing:
Vonoprazan license from Takeda for GERD treatment in India
Symbicort in-license from AstraZeneca for respiratory portfolio
Limitations:
R&D spend ~1.5-2% of revenue (₹223 Cr / ₹13,546 Cr = 1.65%), lower than MNC peers at 8-10%
No blockbuster NCE approvals yet; pipeline in early/mid stages
Women's Health & Fertility Leadership (9/10): The BSV acquisition creates the most defensible competitive advantage with 10+ year durability and very high barriers to entry in biologics/biosimilars
Distribution Network (8/10): Unmatched rural penetration and company-owned distribution infrastructure provide sustainable competitive advantage for 7-8 years
Chronic Therapy Focus (7/10): Strategic shift toward recurring, less price-sensitive chronic therapies is building a durable moat as doctor relationships deepen
Moderate Moats (Ratings 6-6.5):
Cost Leadership (6.5/10): While providing competitive advantages today, cost structures can be replicated by competitors over 3-5 years
R&D Capabilities (6/10): Pipeline is promising but still in early stages; R&D spend at 1.65% of revenue limits innovation velocity compared to global peers
Weak Moats (Rating ≤5):
Manufacturing Quality (5/10): Essential for business operation but not a differentiator; table stakes in the pharmaceutical industry
Competitive Advantage Durability Assessment
5-Year Outlook: POSITIVE
BSV integration will strengthen women's health moat over next 2-3 years
Chronic therapy pivot gaining momentum (37.1% share and rising)
Distribution advantage defensible unless major regulatory changes occur
10-Year Outlook: MODERATE
Risks: Price controls expansion, API import dependency (70% from China), generic competition intensification
Opportunities: Biosimilars commercialization, export market expansion, OTC brand building
Compared to Peers:
Stronger than: Mid-tier generic players (Alkem, Lupin) in distribution and rural reach
Weaker than: Sun Pharma (broader portfolio + global reach), Cipla (higher margins + branded generics), Dr. Reddy's (US market strength)
5Recent Quarterly Performance (Q2 FY2026)
Financial Highlights: Q2 FY26 vs. Q1 FY26 vs. Q2 FY25
Reported Date: November 7, 2025
Metric
Q2 FY26
Q1 FY26
Q2 FY25
QoQ Change
YoY Change
Total Revenue
₹3,789 Cr
₹3,627 Cr
₹3,186 Cr
+4.5%
+18.9%
Operating Revenue
₹3,697 Cr
₹3,532 Cr
₹3,061 Cr
+4.7%
+20.8%
EBITDA
₹1,013 Cr
₹925 Cr
₹1,032 Cr
+9.5%
-1.8%
EBITDA Margin
27.4%
26.2%
33.7%
+120 bps
-630 bps
PBT
₹622 Cr
₹537 Cr
₹847 Cr
+15.7%
-26.6%
PAT (Net Profit)
₹520 Cr
₹445 Cr
₹659 Cr
+17.0%
-21.1%
PAT Margin
14.1%
12.6%
21.5%
+150 bps
-740 bps
EPS (₹)
₹12.38
₹10.60
₹16.28
+16.8%
-24.0%
Sequential Analysis (Q2 FY26 vs. Q1 FY26)
Positive Trends:
Revenue acceleration:+4.5% QoQ indicates improving momentum EBITDA margin expansion:+120 bps to 27.4% driven by operating leverage and BSV integration benefits PAT recovery:+17.0% QoQ suggests profitability normalizing after Q1 disruptions EPS improvement:+16.8% QoQ to ₹12.38
"The company is transforming its DF segment to be future-ready, aiming for sustained industry outperformance across therapeutic and consumer health segments."
On BSV Integration:
"BSV's acquisition represents a pivotal milestone in Mankind's journey, establishing us as market leader in Indian women's health & fertility segment. We are also delighted to welcome BSV's 2,500+ members to our Mankind family."
On OTC Recovery:
"The OTC segment faced supply chain disruptions due to GST rollout and uneven monsoon. We anticipate recovery in H2 FY26 with key brands like Manforce and Gas-o-fast showing healthy secondary sales growth."
No specific FY26 guidance provided, but implied targets:
Domestic organic growth to match/exceed IPM growth (7-8%)
EBITDA margins to normalize toward 28-30% post-integration
BSV synergies to materialize over 18-24 months
Concerns & Red Flags
Critical Issues:
4th Straight Quarter of Profit Decline: PAT down 21.1% YoY in Q2, continuing trend from Q1, Q4 FY25, Q3 FY25
Margin Compression: PAT margin collapsed from 21.5% → 14.1% YoY (740 bps)
Below-IPM Organic Growth: Domestic organic growth at 6% vs. IPM 7.2% indicates market share loss in core business
Debtor Days Worsening: 33.4 → 46.0 days suggests collection challenges or aggressive credit terms to maintain volumes
OTC Segment Decline:-3% YoY in a growing market raises questions about brand strength and distribution effectiveness
Positive Highlights
Sequential Improvement: Q2 showed recovery vs. Q1 with PAT +17% QoQ, suggesting worst may be over
Integration costs: BSV acquisition and OTC subsidiary restructuring
Return Ratios: Deteriorating Capital Efficiency
Return on Equity (ROE):
Year
ROE
Analysis
FY2021
31.51%
Peak efficiency
FY2022
26.72%
Normalizing post-COVID
FY2023
23.14%
Declining trend
FY2024
16.98%
Sharp drop
FY2025 (Latest)
15.52%
Below 16% threshold
Interpretation:
ROE below 16% raises concerns about management's ability to generate adequate returns on shareholder equity. The 1,600 bps decline from FY2021 to FY2025 is alarming.
Return on Capital Employed (ROCE):
FY2023:28.35%
FY2024:18.32%
FY2025:17.05%
Decline: Over 1,100 bps in 2 years Analysis: ROCE deterioration indicates:
Capital deployed in BSV acquisition (₹13,768 Cr) not yet generating commensurate returns
Higher debt levels post-acquisition reducing capital efficiency
Working capital management challenges (debtor days up to 46)
Cash Flow & Liquidity
Financial Health Ratios:
Ratio
FY2025
FY2024
Interpretation
Current Ratio
1.15
3.45
Sharp deterioration; liquidity concern
Quick Ratio
0.86
2.36
Below 1.0 = potential short-term payment issues
Debt-to-Equity
0.50
0.02
25x increase due to BSV acquisition debt
Total Debt
₹7,066 Cr
~₹200 Cr
Massive increase from acquisition
Critical Observation:
Current ratio dropped from 3.45 → 1.15 and quick ratio below 1.0 (0.86) signals potential liquidity stress. While not immediate crisis (current ratio >1), the sharp deterioration warrants monitoring.
Leverage:
Debt increased 35x to fund ₹13,768 Cr BSV acquisition
Debt-to-Equity at 0.50 is manageable but significantly higher than historical 0.02-0.11 range
Finance costs now 3.72% of revenue, highest among major pharma peers
Key Financial Ratios vs. Industry
Ratio
Mankind
Cipla
Sun Pharma
Dr. Reddy's
Industry Avg
PAT Margin
18.86%
25.75%
22-25%
20-22%
21-23%
ROE
15.52%
16-18%
18-20%
17-19%
17-19%
ROCE
17.05%
22-25%
24-26%
21-23%
22-24%
D/E Ratio
0.50
0.05-0.10
0.10-0.15
0.20-0.25
0.15-0.20
Current Ratio
1.15
2.0-2.5
2.5-3.0
2.0-2.5
2.0-2.5
Comparative Analysis: FY2024 vs. Previous Years
Strengths:
Revenue growth momentum sustained:19% in FY24, 15-17% CAGR over 5 years Market share gaining:4.6% → 4.8% in 9M FY25 Chronic therapy pivot succeeding: Share up to 37.1%Prescription leadership maintained: #1 for 8 consecutive years
Concerns:
Profitability deterioration: ROE from 23.14% → 16.98%, ROCE from 28.35% → 17.05%Leverage spike: D/E from 0.02 → 0.50 post-BSV Liquidity tightening: Current ratio from 3.45 → 1.15 Working capital stress: Debtor days from 33.4 → 46.0
Industry Benchmarking
Mankind vs. Top 3 Peers (FY2024):
Revenue Growth:
Mankind:+19% (highest among top 5)
Cipla: +8-10%
Sun Pharma: +9-11%
Dr. Reddy's: +12-14%Verdict: Mankind leading on top-line growth
Profit Growth:
Mankind:+15.4%
Cipla: +18-20%
Sun Pharma: +16-18%
Dr. Reddy's: +15-17%
Operating Efficiency:
Mankind: OPM 24.5%, PAT margin 18.86%
Cipla: OPM 28%, PAT margin 25.75% (best-in-class)
Sun Pharma: OPM 25-27%, PAT margin 22-25%
Dr. Reddy's: OPM 23-25%, PAT margin 20-22%Verdict: Mankind has lowest margins among top 4 players
Part 1 Summary: Key Takeaways
Investment Thesis Highlights
Bullish Factors:
Market Leader in Women's Health: BSV acquisition creates dominant position with high entry barriers
Strong Distribution Moat: Unmatched rural penetration and company-owned distribution
Chronic Therapy Momentum:37.1% share and growing in high-margin, recurring segment
Revenue Growth Leadership:19% FY24 growth, outpacing peers and IPM
Prescription Leadership: #1 for 8 consecutive years
Bearish Factors:
4 Consecutive Quarters of Profit Decline: PAT down 21% YoY in Q2 FY26
ROE/ROCE Deterioration: ROE from 31% → 15.5%, ROCE from 28% → 17% over 4 years
Margin Compression: PAT margin lowest among top 4 peers at 18.86%
Liquidity Concerns: Current ratio dropped to 1.15, quick ratio below 1.0
Elevated Leverage: D/E jumped to 0.50 post-BSV, finance costs highest among peers
Below-IPM Organic Growth: Domestic organic 6% vs. IPM 7.2%
Moat Strength: 67.3% (MODERATE TO STRONG)
Strongest Moats: Women's health leadership (9/10), distribution network (8/10)
EV/Sales: 8.0x; EV/EBITDA: 28.0x (premium to industry avg 15-20x)
Funding Structure
Debt-funded (D/E ratio increased from 0.02 → 0.50)
Strategic Rationale:
Market Leadership in Women's Health & Fertility:
BSV holds dominant position in Indian fertility segment
12 out of 15 top fertility drugs in portfolio
Leadership in Anti-D immunoglobulin (Rhoclone brand), Anti-thymocyte globulin (Thymogam)
Entry into High-Barrier Biologics/Biosimilars:
Complex manufacturing requiring 5-10 years to replicate
BSV is only innovator worldwide to develop patented recombinant Anti-D
Regulated biologics for critical care (immunoglobulins, anti-venoms)
Export Market Expansion:
BSV operates in 70+ countries vs. Mankind's limited international presence
Approved manufacturing facilities for regulated markets (US FDA, WHO-GMP)
Therapy Area Diversification:
Moves Mankind beyond branded generics into specialty/super-specialty segment
Addresses chronic therapy focus (fertility treatments are long-duration)
Integration Progress & "Say to Do" Ratio
Management Guidance (February 2025):
"Synergies will materialize over 12-24 months. BSV expected to deliver single-digit growth in FY25, accelerating to 15%+ from FY26 onwards, with exports seeing faster growth."
Expected Synergies (As Communicated):
Revenue Synergies:
Leverage Mankind's 10,000+ MR force to expand BSV's doctor reach
Cross-sell BSV fertility portfolio through Mankind's gynecology network
Potential OTX (over-the-counter) shift for select BSV products
Export acceleration using Mankind's regulatory expertise for new market approvals
Cost Synergies:
₹50-100 Crores annual savings from operational efficiencies
MR productivity improvement (BSV had lower productivity than Mankind)
Procurement leverage on raw materials and excipients
Actual Progress (6-9 Months Post-Closing):
Q2 FY26 Results (November 2025):
Metric
Target/Expectation
Actual Performance
Status
BSV Revenue
Single-digit in FY25
Single-digit in FY25
Q2 export growth +83% YoY (mostly
Exceeding
Exceeding
Growth
BSV)
Integration Timeline
12-24 months
In progress (6 months completed)
On Track
Synergy
₹50-100 Cr annual
"Slow to materialize" per analyst
Behind
Realization
reports
Schedule
Margin Impact
BSV EBITDA 28.4% accretive
Mankind EBITDA margin down to 27.4% from 33.7%
Dilutive
Organic Growth
Minimal disruption
Domestic organic growth slowed to 6%
Concern
Impact
vs IPM 7.2%
Management Commentary (Q2 FY26 Earnings Call):
"BSV acquisition represents a pivotal milestone... We are delighted to welcome BSV's 2,500+ members to Mankind family. BSV growth initiatives are making steady progress."
Operational Milestones Achieved:
Rx Portfolio Integration: BSV's TTK prescription brands merged with Mankind distribution (completed) Workforce Integration:2,500+ BSV employees absorbed Regulatory Continuity: No disruption to export approvals or manufacturing licenses Market Share Maintained: BSV's leadership in fertility segment intact
"Say to Do" Ratio Assessment
Score: 6.5/10 (moderate Execution)
Rationale:
Promises Kept:
Export growth exceeding expectations (+83% vs. single-digit guidance)
Integration timeline on schedule (12-24 months, currently at 6 months)
No major operational disruptions to BSV business
Promises Delayed/Challenged:
Synergy realization is "slow" per external analysts
Margin dilution (27.4% vs. 33.7% YoY) not communicated upfront
Domestic business slowdown (6% growth vs. IPM 7.2%) suggests management distraction from core operations
Debt servicing costs (finance costs at 3.72% of revenue, highest among peers) are pressuring margins. If synergies don't materialize by FY26 as promised, the acquisition ROI will be questioned by investors.
Anti-diabetic APIs (Metformin): 60-70% China-sourced "Company procures most raw materials from domestic market and imports remaining from China
and other countries."
Geopolitical Risks & Vulnerability Assessment
Risk #1: China-India Border Tensions
Impact:
Immediate: 20-30% API price increases due to supply disruption
3-6 Months: Production halts for formulations dependent on China-only APIs
Estimated Revenue Impact: 15-20% decline if prolonged beyond 6 months
Mankind's Exposure: HIGH (8/10)
As a volume-focused, price-sensitive player, cannot absorb 20-30% cost increases without margin compression
Limited API backward integration (only 42 APIs) vs. 300+ molecules formulated
Mitigation Actions Identified:
Government's PLI scheme promoting domestic API production (Mankind not a major beneficiary yet)
Bulk Drug Parks in Himachal, Gujarat, Andhra Pradesh (long-term solution, 5-7 years)
Mankind exploring domestic API sourcing where feasible but options limited
Risk #2: COVID-Style Supply Chain Disruptions
Precedent: 2020 lockdowns in Hubei province (China's API hub) caused global shortages
Impact on Indian Pharma:
India imposed temporary export bans on 26 APIs and formulations
API prices surged 40-60% for select molecules
Production delays of 2-4 months industry-wide
Mankind's Vulnerability: MODERATE-HIGH (7/10)
High inventory turnover (3.22% of revenue) means low safety stock (typically 45-60 days vs. industry 90-120 days)
Limited buffer against extended supply disruptions
Fast-moving acute therapy portfolio (anti-infectives, analgesics) most exposed
Risk #3: US-China Trade War Spillover
Secondary Impact on India:
If US restricts Chinese APIs, global demand shifts to India → Indian API prices rise 20-30%
Alternatively, China dumps excess capacity in India at predatory pricing → Domestic API
manufacturers suffer
Mankind's Positioning: MODERATE RISK (6/10)
Limited US market exposure (exports ~10% of revenue, growing to 15%)
But domestic API cost increases would impact 84% of revenue (domestic formulations)
Other Critical Sourcing Dependencies
Key Starting Materials (KSMs):
Intermediates used in API synthesis also 60-70% China-sourced
Dependency deeper than just finished APIs; entire supply chain China-centric
Excipients:
Pharmaceutical-grade excipients (HPMC capsules, specialized coatings) have 40-50% China
sourcing
Less critical than APIs but still material dependency
Packaging Materials:
Aluminum foil for blister packs: 30-40% China imports
Mankind's in-house packaging production partially mitigates this
Country-Wise Sourcing Exposure (Estimated)
Geography
API Sourcing %
KSM/Intermediates %
Geopolitical Risk Rating
China
60-70%
70-80%
HIGH
India (Domestic)
20-25%
15-20%
LOW
Europe (Italy, Spain)
5-10%
3-5%
LOW
Other Asia (Korea, Taiwan)
3-5%
2-3%
MODERATE
Regulatory & Trade Policy Risks
DPCO (Drug Price Control Order) Impact:
930 scheduled formulations under price ceiling (17% average price cut)
Estimated 30-35% of Mankind's portfolio under NLEM price controls
Cannot pass on API cost increases for price-controlled drugs → margin squeeze
Import Duty Changes:
Government periodically adjusts import duties on APIs and KSMs
Risk: If duties increase to protect domestic API industry, Mankind's procurement costs rise
Opportunity: If duties incentivize domestic API production, long-term positive
Example:
"NPPA has fixed ceiling prices for 930 scheduled formulations... average price reduction due to NLEM 2022 was about 17%, resulting in estimated annual savings of ₹3,788 crore to patients."
Impact on Mankind: This ₹3,788 Cr industry-wide revenue loss disproportionately affects volume players like Mankind.
Overall Geopolitical Risk Rating: 7.5/10 (HIGH)
Justification:
China dependency for 60-70% APIs is structural and difficult to diversify short-term (5-7 years needed)
Geopolitical tensions (border disputes, trade conflicts) are recurring and unpredictable
Company's low inventory buffers (3.22%) provide minimal protection against supply shocks
Price-controlled portfolio (~30-35%) limits ability to pass through cost increases
10Raw Material Shortage Risks
Scenario #1: Weather-Dependent Raw Materials (Herbal/Natural APIs)
Applicable to Mankind? LOW RISK (3/10)
Rationale:
Mankind's portfolio is predominantly synthetic chemical-based formulations (anti-infectives, cardiovascular, anti-diabetics)
Limited exposure to herbal/natural APIs (except select Ayurvedic/OTC products)
OTC segment (7% of revenue) includes some herbal wellness products (HealthOK), but contribution minimal
Example:
Gas-O-Fast (antacid) contains herbal ingredients like Ajwain, Jeera
Weather disruptions (monsoon failure) could impact raw material availability
Mitigation: Multiple supplier relationships; herbal ingredients are commoditized
Scenario #2: Disease Outbreaks in Agricultural Feedstocks
Applicable to Mankind? MINIMAL RISK (2/10)
Rationale:
Pharmaceutical APIs are not typically derived from agricultural crops susceptible to disease (unlike biotech/bio-pharma)
Exception: Fermentation-derived APIs (some antibiotics) use corn/wheat-based media
Mankind's antibiotic portfolio exposure: ~14% of revenue (anti-infectives)
Potential Impact:
Corn blight or wheat rust → fermentation media costs rise 10-15%
But this is indirect and second-order impact; easily substitutable with alternative feedstocks
Scenario #3: Regulatory Changes Restricting Raw Materials
Applicable to Mankind? MODERATE-HIGH RISK (7/10)
Key Concerns:
Environmental Regulations on API Manufacturing:
China's environmental crackdown (2018-2020) shut down polluting API plants, reducing global supply and spiking prices 40-60%
If repeated, Mankind faces 20-30% cost increases on China-sourced APIs
India's Own Environmental Norms:
Stricter effluent treatment norms for pharma manufacturing
Mankind's plants must comply; capex required for ETP upgrades
FY25: Company recycled 45% wastewater and achieved 85% carbon emission reduction
Controlled Substance Regulations:
Opioid analgesics and psychotropic drugs face tighter quota restrictions
Impact: If Mankind's pain management portfolio includes controlled substances, manufacturing quotas could limit volumes
Company Disclosure: Not a material issue per annual report
Quality/Impurity Standards (USP/BP/IP):
Tightening of impurity limits (e.g., nitrosamines in sartans) can render existing API batches unusable
Example: 2018 valsartan recall due to NDMA impurity affected entire industry
Mankind's Response: Quality control investments; no major recalls disclosed
Estimated ~30-35% of Mankind's revenue under NLEM price controls
Recent Developments:
"Trade margin of 42 non-scheduled anti-cancer medicines have been capped, resulting in 50% price reduction for 526 brands, saving ₹984 Cr annually for patients."
Estimated revenue potential:₹500-700 Cr by FY28 from pending approvals
Technology Leadership Assessment
Strengths:
Formulation expertise: 300+ molecules formulated across diverse delivery systems Biosimilars capability: BSV acquisition brings critical care biologics know-how ANDA filing experience: 60+ US filings demonstrate regulatory capability Patent portfolio growing: 241 patents (84% active) with India-US-EU coverage
Weaknesses:
Low R&D intensity (1.65%) limits innovation velocity vs. peers (6-8%) No blockbuster NCEs approved yet; pipeline still 5-10 years from market Technology leadership in generics, not innovation: Company follows rather than leads in novel drug discovery Biosimilars R&D nascent: Post-BSV, still building capability (takes 5-7 years)
Overall R&D & IP Rating: 5.5/10 (MODERATE)
Justification:
Patent portfolio adequate for generics business but not differentiated
NCE pipeline promising but long gestation (8-10 years) and high risk
US ANDA strategy solid but slow execution (only 1 new launch in Q1 FY26)
R&D spend too low (1.65%) to compete with innovation-focused peers
Impact on Investment Thesis:
Short-term (1-3 years): R&D not a growth driver; focus on marketed generics
Medium-term (3-5 years): US ANDA pipeline can add ₹500-700 Cr revenue
Long-term (7-10 years): NCE success critical for sustained differentiation; currently uncertain
Part 2 Summary: Key Takeaways
Strategic Execution Assessment
BSV Acquisition:
Strategic fit strong – Women's health leadership, biologics entry, export expansion Synergy realization slow – Margins diluted, profitability under pressure 6 months post-close Execution concerns – Domestic business growth slowed to 6% (below IPM 7.2%)
Say-to-Do Ratio: 6.5/10 – On track but synergies delayed vs. promises
Supply Chain Vulnerabilities
Critical Dependencies:
70% API dependency on China – Highest geopolitical risk (rating: 7.5/10) NLEM price controls – 30-35% of portfolio under ceiling prices, limits margin recovery Cost advantages – Inventory (3.22%) and freight (0.73%) efficiency vs. peers
Raw Material Risk: 6.5/10 – China dependency structural; 5-7 years to diversify
Industry Headwinds
Sales Risks:
Acute therapy commoditization – 63% of revenue in highly competitive, low-margin segment Price control expansion risk – Potential ₹200-250 Cr revenue loss if 10% portfolio added to NLEM Chronic therapy outperformance – Growing 1.4-1.6x IPM in focus areas (cardiology, diabetes)
Industry Risk: 6.8/10 – Headwinds manageable but require proactive portfolio shifts
241 patents (84% active) – Adequate for generics focus 4 NCEs in pipeline – 2 in clinical stages, but 8-10 years to market 60+ US ANDAs filed – 45 approved, revenue potential ₹500-700 Cr by FY28
Key Insight: Acute therapy portfolio (63% of domestic revenue) is systematically underperforming IPM,
growing at only 0.8-0.9x industry rates. This explains why overall domestic organic growth (6%) trails IPM (7.2%) despite chronic therapy outperformance.
Management Strategy:
"Company is transforming its DF [Domestic Formulations] segment to be future-ready, aiming for sustained industry outperformance... focusing on chronic therapies to improve product mix and margins."
Segment Risk Rating: MODERATE-HIGH (6/10)
Risk: Acute therapy commoditization accelerating; if chronic shift doesn't compensate, domestic growth will remain sub-IPM
Mitigation: Increase chronic share from 37% to 45% by FY27 (management target)
Segment #2: Export Business (10-15% of Revenue, Growing Post-BSV)
Adverse Monsoon: Uneven rainfall impacted rural distribution and demand
Structural Challenges:
Restructuring Impact: OTC business transferred to subsidiary "Mankind Consumer Healthcare" in September 2024; transition disruptions
Competitive Intensity: HUL, Reckitt, P&G dominate mass OTC; Mankind lacks brand recall vs. MNCs
Management Guidance:
"OTC segment faced supply chain disruptions... We anticipate recovery in H2 FY26 with key brands like Manforce and Gas-O-Fast showing healthy secondary sales growth."
Segment Risk Rating: MODERATE-HIGH (6.5/10)
Risk: Primary-secondary sales divergence (secondary +14% to +36%, primary -3%) unsustainable; channel de-stocking if demand weakens
Opportunity: OTC growing 10-12% CAGR in India; Mankind targets increasing share from 6% to 15% of revenue by FY28
Segment #4: Women's Health & Fertility (Post-BSV Acquisition, Emerging Segment)
Segment Status: NEW – Consolidated from February 2025
Action: Accelerate US market entry; commercialize pending approvals by FY27
14Shareholding Pattern Changes
Current Shareholding Structure (September 2025 Quarter)
Stakeholder Category
Sep-25
Jun-25
Mar-25
Dec-24
Sep-24
YoY Change
Trend
Promoters
72.67%
72.68%
72.70%
72.71%
74.87%
-2.20%
Declining
FII/FPI
12.83%
13.07%
12.92%
13.34%
12.37%
+0.46%
↔ Volatile
Mutual Funds
7.78%
7.55%
7.34%
7.58%
6.99%
+0.79%
Increasing
Insurance Companies
1.77%
1.92%
2.11%
2.19%
2.34%
-0.57%
Declining
DII - Others
2.36%
2.03%
2.02%
1.28%
0.57%
+1.79%
Increasing
Retail & Others
2.57%
2.75%
2.89%
2.89%
2.86%
-0.29%
Declining
Key Shareholding Changes & Analysis
#1: Promoter Stake Dilution (-2.20% YoY)
Magnitude:74.87% (Sep-24) → 72.67% (Sep-25)
Root Cause: BSV Acquisition Financing
₹13,768 Crore acquisition completed February 2025
Funded through equity + debt mix
Likely equity issuance or preferential allotment to institutional investors diluted promoter stake
Assessment:
Positive: Dilution for strategic acquisition (not promoter exit) Comfortable:72.67% promoter holding is still high and stable (vs. <50% for many peers) Watch: Further dilution below 70% would be concerning; 72%+ provides adequate control
Promoter Pledge Status: 0.00% (No pledged shares) Interpretation: Strong financial position; no liquidity stress requiring pledge-based borrowing
#2: FII/FPI Stake Volatility (+0.46% YoY, but declining QoQ)
Margin compression concerns: PAT down 21% YoY despite revenue +21%
BSV integration challenges: Synergies "slow to materialize" per analyst reports
Valuation concerns: PE ratio 52x vs. peers 20-25x
4. 4 consecutive quarters of profit decline
MarketsMojo Analysis:
"FII holdings declined to 12.84% in September 2025 from 13.35% in December 2024, suggesting reduced foreign investor conviction amid operational challenges. The 0.23 percentage point sequential decline in Q2 FY26 indicates ongoing selling pressure."
Outlook: Further FII selling risk if Q3 FY26 results disappoint; watch for break below 12% (would signal loss of confidence)
#3: Mutual Fund Stake Increase (+0.79% YoY, +0.23% QoQ)
Pattern:
Sep-24: 6.99% → Dec-24: 7.58% → Mar-25: 7.34% → Jun-25: 7.55% → Sep-25: 7.78% Trend: Consistent accumulation over past year
Number of Mutual Funds Holding: 32 schemes (as of Sep-25) Assessment: Moderate conviction; 32 funds is decent but not broad-based (vs. 80-100+ for Sun Pharma/Cipla)
Interpretation:
Domestic institutional support: MFs buying on dips, viewing correction as opportunity Contrarian to FII selling: Domestic institutions providing price support
Limited breadth: Only 32 MF schemes = concentration risk; if large holders exit, sharp decline possible
#4: Insurance Company Stake Decline (-0.57% YoY)
Pattern:
Sep-24: 2.34% → Dec-24: 2.19% → Mar-25: 2.11% → Jun-25: 1.92% → Sep-25: 1.77% Trend: Steady exit over past year (losing 0.57 percentage points)
Mankind's 4 quarters of profit decline + margin volatility + elevated PE (52x) mismatches insurer mandates Assessment: Red flag – Insurance exits often signal concerns about earnings quality/sustainability
BSV acquisition debt funding: Banks/NBFCs taking equity as part of debt-equity swap or structured deals
Opportunistic buying: Other DIIs (pension funds, sovereign wealth) viewing correction as entry point
Assessment: Positive but needs monitoring; if linked to debt restructuring, could indicate financial stress (unlikely given 0% pledge)
Significant Shareholder Movements (Entries/Exits)
Notable Entries (Past 6 Months):
Data not publicly disclosed for individual institutional investors beyond aggregate categories
Inference: Mutual fund increase (+0.79% YoY = ₹729 Cr market value at ₹92,000 Cr market cap) suggests 2-3 large MF schemes initiated positions
Notable Exits:
Insurance companies exiting (~₹526 Cr market value reduction)
FII selling in Q2 FY26 (~₹220 Cr market value)
Implications for Stock Price & Investment Thesis
Positive Signals:
72.67% promoter holding with 0% pledge = Strong insider confidence Mutual fund accumulation = Domestic institutional support; price floor likely at ₹2,200-2,250 levels Promoter dilution for strategic acquisition (not promoter exit)
Negative Signals:
FII selling pressure = International investors losing conviction; risk of further de-rating Insurance company exits = Concerns about earnings stability and valuation sustainability Narrow mutual fund base (32 schemes) = Limited institutional depth; vulnerable to outflows
Cautiously Optimistic on BSV: "BSV acquisition strategic but expensive at 28x EV/EBITDA; synergies critical for ROI. Expect single-digit BSV growth in FY25, accelerating to 15%+ from FY26."
Domestic Business Concerns: "Organic growth slowing to 6% vs. IPM 7.2%; acute therapy commoditization impacting volumes."
Long-Term Positive: "Chronic therapy shift and BSV integration position company well for FY27-28; short-term margin pressure acceptable."
Valuation Note: "Current PE of 50x leaves limited margin for error; upgrade to BUY only if Q3 FY26 shows margin recovery above 28%."
#3: Axis Securities – BUY (Target: ₹2,750)
Rating: BUY
Target Price:₹2,750 (+23% upside)
Key Arguments:
Market Leadership: "Mankind's prescription leadership (#1 for 8 years) and rural distribution moat undervalued."
OTC Recovery Expected: "H2 FY26 OTC rebound post-GST stabilization; secondary sales (+14% to +36% for key brands) validate demand strength."
US ANDA Pipeline: "45 approved ANDAs with slow commercialization pace = hidden value; US revenue can double to ₹800 Cr by FY27."
#4: Kotak Institutional Equities – HOLD (Target: ₹2,450)
Rating: ADD (equivalent to HOLD)
Target Price:₹2,450 (+9% upside)
Key Concerns:
Profit Decline Trend: "4th consecutive quarter of PAT decline raises execution concerns; Q2 PAT down 21% YoY despite revenue +21%."
Margin Compression: "PAT margin collapsed from 21.5% → 14.1% YoY; finance costs (3.72%) highest among peers due to BSV debt."
Neutral-to-Sideways Trend: "As of November 10, 2025, technical trend changed from mildly bearish to sideways; mixed signals suggest consolidation at lower levels."
Support Breakdown Risk: "Key support at ₹2,250; break below opens ₹2,100-2,150 downside."
Current Price & Key Levels (As of November 19, 2025)
Metric
Value
Analysis
Current Price
₹2,223.10
Down 1.5% from prior week
52-Week High
₹3,054.80 (Dec 23, 2024)
-27.2% from peak
52-Week Low
₹2,115.10 (Mar 18, 2025)
+5.1% from bottom
52-Week Range Position
32.6%
Lower-third of range (bearish)
Market Cap
₹92,667 Crores
Down ₹13,751 Cr (-13%) vs. 1 year ago
Moving Averages Analysis
Simple Moving Averages (SMA):
Period
SMA Value
Current vs. SMA
Signal
Trend
MA-5
₹2,605
-14.6% below
SELL
Very bearish
MA-10
₹2,593
-14.3% below
SELL
Bearish
MA-20
₹2,608
-14.8% below
SELL
Bearish
MA-50
₹2,634
-15.6% below
SELL
Strong bearish
MA-100
₹2,601
-14.5% below
SELL
Bearish
MA-200
₹2,470
-10.0% below
BUY
Long-term support
Exponential Moving Averages (EMA):
Period
EMA Value
Current vs. EMA
Signal
EMA-5
₹2,601
-14.5% below
SELL
EMA-20
₹2,608
-14.8% below
SELL
EMA-50
₹2,615
-15.0% below
SELL
EMA-200
₹2,527
-12.0% below
BUY
Data Source:
Interpretation:
Strong Bearish Signal: Stock trading below ALL short-to-medium term moving averages (5-100 day), indicating sustained downtrend. Only MA-200 (₹2,470) and EMA-200 (₹2,527) provide long-term support.
Consensus from 12 Moving Averages: 9 SELL vs. 3 BUY → OVERALL SELL
Technical Indicators
Relative Strength Index (RSI-14):
Source
RSI Value
Interpretation
Signal
Investing.com
43.57
Below 50 (bearish), but above 30 (not oversold)
SELL
Moneycontrol
35.86
Approaching oversold (<30), but bearish momentum
OUTPERFORM (contrarian)
Analysis:
RSI 35-44 range = Weak momentum but not yet oversold. Historical pattern: RSI below 40 often precedes further declines unless fundamental catalyst emerges.
Macd (12, 26, 9):
Source
MACD Value
Signal Line
Histogram
Interpretation
Investing.com
-8.47
Negative
Bearish crossover
SELL
Moneycontrol
-25.85
Negative
Strong bearish divergence
OUTPERFORM (oversold)
Top Stock Research
-61.46
Signal: -52.5
Mild bearish
SELL
Analysis:
Bearish MACD across all timeframes; histogram negative indicates selling pressure dominant. However, extreme negative readings (-61.46) suggest potential oversold bounce opportunity.
Stochastic Oscillator (9, 6) & Stochastic RSI:
Indicator
Value
Zone
Signal
Stochastic (9,6)
62.13
Neutral (40-60 = equilibrium)
BUY
Stochastic RSI (14)
57.28
Neutral-to-bullish
BUY
Moneycontrol Stochastic (20,3)
13.61
Oversold (<20)
Strong BUY
Analysis:
Stochastic indicators showing oversold conditions, suggesting potential short-term bounce. However, bearish trend (moving averages + MACD) may override stochastic signals.
Average Directional Index (ADX-14):
Source
ADX Value
Interpretation
Investing.com
19.62
Weak trend (ADX <25 = no clear trend)
NEUTRAL
Top Stock Research
25.59
Moderate trend strength
Bearish trend confirmed
Analysis:
ADX 19-26 = Weak-to-moderate trend strength. Current downtrend not strong enough to suggest panic selling, but also insufficient bullish momentum for reversal.
Williams %R (14):
Value
Zone
Signal
-62.80
Between -80 (oversold) and -20 (overbought)
SELL (bearish momentum)
Commodity Channel Index (CCI-20):
Source
CCI Value
Interpretation
Moneycontrol
-196.03
Strong oversold (CCI <-100)
BUY (contrarian)
Analysis:
CCI at -196 indicates extreme oversold; historical pattern shows CCI <-150 often precedes 3-5% bounce within 2-3 weeks.
Technical Indicator Consensus
From Investing.com (7 Indicators):
SELL: 5 indicators (RSI, MACD, Williams %R, ROC, Bull/Bear Power)
Volume declining during consolidation (typical of descending triangle)
Implication:
Bearish pattern suggests breakdown below ₹2,200 support could trigger move toward ₹2,050-2,100. Conversely, breakout above ₹2,450 would invalidate pattern and signal reversal.
Volume Analysis
Average Trading Volume:
Daily Volume (3-month avg): ~1.5-2.0 million shares
Below lower Bollinger Band = statistically due for reversion
• Support at ₹2,200-2,250 holding (tested 3x)
Bull Case (30% probability): Bounce to ₹2,400-2,450 if Q3 FY26 results exceed expectations
Bear Case (25% probability): Break below ₹2,200 → Test ₹2,050-2,100 (52-week low zone)
Medium-Term (6-12 Months): CAUTIOUSLY BULLISH
Rating: 6/10 (Neutral-to-Bullish)
Rationale:
• MA-200 (₹2,470) holding as long-term support
Broker consensus target ₹2,625 (+18% from current) suggests recovery expected
BSV synergy realization in H2 FY26 / FY27 could drive re-rating
Chronic therapy pivot improving product mix (37% → 45% target) Target Range (12-month):₹2,500-2,800 (+12% to +26%)
Key Trigger: EBITDA margin recovery above 28% in Q3/Q4 FY26
17Competition Analysis
Competitive Landscape: India's Top Pharmaceutical Companies
Market Cap Ranking (November 2025):
Rank
Company
Market Cap
1-Year
Key Strengths
Key Weaknesses
(₹ Cr)
Return
1
Sun Pharma
3,96,418
3,96,418
+3.0%
+3.0%
Global reach, specialty
Stagnant growth,
drugs, US leadership
regulatory risks
2
Cipla
1,14,326
-0.5%
Highest margins (25.8%), respiratory leadership
Limited growth, mature portfolio
3
Dr. Reddy's
1,09,868
N/A
US generics strength,
API dependency, slower
biosimilars
growth
4
Torrent Pharma
1,05,825
+61% (best)
Strong domestic CNS/cardio, Brazil presence
Limited scale vs. top 3
5
Mankind
92,667
-14.3%
Rural distribution,
Lowest margins, BSV
Pharma
(worst)
prescription leadership
integration challenges
Head-to-Head Comparison: Mankind vs. Key Peers
Financial Metrics Comparison (FY2024/Latest TTM):
Metric
Mankind
Sun
Cipla
Dr.
Peer
Mankind Rank
Pharma
Reddy's
Average
Revenue (₹ Cr)
13,546
48,000+
28,000+
27,000+
34,333
#4 (smallest)
Net Margin
18.9%
22-25%
25.8%
20-22%
22.7%
#4 (lowest)
ROE
15.5%
18-20%
16-18%
17-19%
17.3%
#4 (lowest)
ROCE
17.1%
24-26%
22-25%
21-23%
23.0%
#4 (lowest)
D/E Ratio
0.50
0.10-0.15
0.05-
0.20-0.25
0.15
#4 (highest
0.10
leverage)
PE Ratio (TTM)
52.4x
~35x
23.6x
19.3x
26.0x
#1 (most expensive)
Revenue Growth
+19%
+9-11%
+8-10%
+12-14%
11%
#1 (fastest)
(FY24)
IPM Market Share
4.8%
8-9% (est.)
5-6%
4-5%
6.0%
#3
Key Competitive Dynamics
#1: Mankind vs. Sun Pharma (Market Leader)
Sun Pharma Advantages:
4x larger revenue (₹48,000 Cr vs. ₹13,546 Cr) Global footprint: 8-9% IPM share PLUS significant US/RoW presence Specialty drugs portfolio: Differentiated from generic competition Higher margins: Net margin 22-25% vs. Mankind 18.9%
Mankind Advantages:
Faster growth:+19% vs. Sun's +9-11% (FY24) Prescription leadership: #1 for 8 years (Sun Pharma not focused on domestic Rx share) Rural penetration: Deeper reach in Tier III-IV markets Chronic therapy momentum: Growing 1.5-1.6x IPM vs. Sun's flattish chronic growth
Head-to-Head Assessment:
Sun Pharma dominates overall, but Mankind gaining in specific segments (domestic branded generics, rural markets). Mankind unlikely to overtake Sun's leadership but can carve defensible niche.
#2: Mankind vs. Cipla (Margin Leader)
Cipla Advantages:
Industry-leading margins: Net margin 25.8% vs. Mankind 18.9% (690 bps gap) Respiratory dominance: Market leader in inhalers; Mankind distant #4-5 Lower cost structure: Employee costs 15.6% vs. Mankind 21.3%, freight 1.18% vs. 0.73%Stronger balance sheet: D/E 0.05 vs. Mankind 0.50
Mankind Advantages:
Faster top-line growth:+19% vs. Cipla +8-10% (FY24) Inventory efficiency:3.22% vs. Cipla 7.88% (significant working capital advantage) Prescription share momentum: Mankind gaining, Cipla stable
Head-to-Head Assessment:
Cipla clearly superior on profitability and financial health. Mankind's 690 bps margin gap is the single biggest competitive weakness. Unless Mankind narrows this gap to <400 bps by FY27, valuation premium (PE 52x vs. Cipla 24x) is unsustainable.
Management Commentary on Margin Gap:
"Company is transforming to improve margin profile through chronic therapy mix shift (37% → 45%), BSV integration (28% EBITDA margin), and operating leverage."
#3: Mankind vs. Dr. Reddy's (US Market Focus)
Dr. Reddy's Advantages:
US market strength: Generates 40%+ revenue from US generics; Mankind only ~3%Biosimilars leadership: Established biosimilar portfolio; Mankind just entering via BSV Better margins: Net margin 20-22% vs. Mankind 18.9%Lower freight costs:2.41% vs. Mankind 0.73% (offset by Mankind's domestic focus advantage)
Mankind Advantages:
Domestic market leadership:4.8% IPM vs. Dr. Reddy's 4-5%Faster growth:+19% vs. Dr. Reddy's +12-14% (FY24) Rural distribution moat: Dr. Reddy's primarily urban/metro Women's health leadership (post-BSV): Dr. Reddy's lacks this franchise
Head-to-Head Assessment:
Different strategic focus: Dr. Reddy's = US-centric global player; Mankind = India-centric rural specialist. Limited direct competition except in domestic acute therapies (both underperforming).
#4: Mankind vs. Torrent Pharma (Best 1-Year Performer)
Torrent Advantages:
Best stock performance:+61% (1-year) vs. Mankind -14%Brazil market dominance: #1 pharma company in Brazil; Mankind no LATAM presence CNS/Cardio specialization: Strong therapeutic focus vs. Mankind's diversified acute portfolio
Mankind Advantages:
Larger scale:₹13,546 Cr revenue vs. Torrent ~₹11,000-12,000 Cr Higher growth:+19% vs. Torrent ~12-15% (FY24) Prescription leadership: Torrent not in top 3 for Rx share BSV biologics franchise: Torrent lacks biosimilars capability
Head-to-Head Assessment:
Torrent's stock outperformance driven by Brazil turnaround story; Mankind's BSV integration yet to translate to stock gains. Both mid-tier players with distinct geographic/therapeutic niches.
Competitive Positioning Matrix (Continued)
Parameter
Mankind
Nearest Competitor
Gap Analysis
Positioning
Domestic Market Share
4.8% (#3-4)
4.8% (#3-4)
Sun Pharma 8-9% (#1)
-320 bps gap; unlikely to
(IPM)
close
Prescription Share
#1 (8 years)
Cipla/Sun (#2-3)
Competitive advantage
Net Profit Margin
18.9% (#4)
Cipla 25.8% (#1)
-690 bps gap; critical
weakness
Rural Reach (Tier III-IV)
#1
Sun Pharma (#2)
Competitive advantage
Chronic Therapy Growth
1.5x IPM
Sun/Cipla 1.0-1.2x IPM
Competitive advantage
US Market Revenue
3% of total (#5)
Dr. Reddy's 40% (#1)
-37% gap; underdeveloped
Women's Health
#1 (post-BSV)
Limited peer presence
Unique competitive
Leadership
advantage
Biologics/Biosimilars
Emerging (BSV)
Dr. Reddy's/Cipla established
5-7 year gap; catching up
Areas for Improvement & Management Commentary
#1: Margin Expansion (Critical Priority)
Gap:690 bps below Cipla (18.9% vs. 25.8%)
Root Causes Identified:
Employee costs:21.34% vs. peer average 13-15%
Finance costs:3.72% (BSV debt) vs. peer average 0.5-1.0%
"Transforming domestic formulations business to be future-ready through chronic therapy mix improvement (37% → 45% target), BSV synergy realization (₹50-100 Cr annual savings), and operating leverage as revenue scales."
Target: EBITDA margin 28-29% by FY27 (vs. current 27.4%)
#2: US Market Penetration (Growth Opportunity)
Gap: US revenue ~₹300-400 Cr (3% of total) vs. Dr. Reddy's ₹10,000+ Cr (40% of total)
Challenges:
Slow ANDA commercialization: Only 1 new product launch in Q2 FY26
Limited sales infrastructure: Relying on partners vs. direct-to-wholesaler model
Management Commentary:
"60+ US ANDAs filed, 45 approved; focus on accelerating launches and complex generics with 180-day exclusivity opportunities."
Opportunity: If Mankind commercializes 15 pending ANDAs by FY27, US revenue could double to ₹600-800 Cr
#3: Acute Therapy Portfolio Turnaround
Gap: Acute therapies (63% of domestic revenue) growing at 0.8-0.9x IPM (lagging competition)
Challenges:
Commoditization: 20-30 brands per molecule; price erosion 5-8% annually
Seasonality: Anti-infectives dependent on monsoon/winter (volatile)
Management Strategy:
"Accepting acute portfolio will underperform IPM; strategic focus is shifting resources to chronic therapies where we can achieve 1.4-1.6x IPM growth and build sustainable moats."
Realism: Management acknowledging acute segment structural headwinds rather than over-promising turnaround
#4: International Expansion Beyond India
Gap: Exports 10-15% of revenue vs. Sun Pharma 50%+, Dr. Reddy's 60%+
BSV Acquisition Catalyst:
BSV operates in 70+ countries (primarily Europe, select Asia)
Mankind can leverage BSV's regulatory approvals and distribution for own ANDA portfolio Management Target: Increase exports to 20-25% of revenue by FY28 (from current 15%)
Competitive Threats & Defensive Moats
Threat #1: Sun Pharma/Cipla Entering Rural Markets
Likelihood: MODERATE (5/10) Impact: HIGH (8/10) – Would erode Mankind's core moat
Defensibility:
7-10 years to replicate Mankind's 10,000+ MR rural distribution network
Doctor relationships sticky (8-year prescription leadership)
Cost-prohibitive for large players to serve low-volume Tier III-IV markets Verdict: Moat defensible for 5-7 years barring major competitor pivot
Threat #2: E-Pharmacy Disruption of Distribution Advantage
Likelihood: HIGH (7/10) Impact: MODERATE (5/10) – Partial erosion, not complete
Defensibility:
Rx drugs still require doctor prescription (e-pharmacy doesn't bypass doctor relationship)
Rural markets underserved by e-commerce (logistics, digital adoption challenges)
OTC segment vulnerable (20-40% discounts online erode brand equity) Verdict: Partial threat; Rx business protected, OTC segment at risk
Threat #3: Generic Competition Post-Patent Expiry
Likelihood: CERTAIN (10/10) Impact: LOW (3/10) – Mankind benefits from patent expiries
Lowest margins among top 5 (690 bps below Cipla) Acute portfolio lagging IPM (63% of revenue underperforming) Limited US presence (3% of revenue vs. 40%+ for global peers) Narrow margin for error given premium valuation (PE 52x vs. peers 20-25x)
18Valuation
Current Valuation Multiples (November 19, 2025)
Market Data:
Current Price:₹2,223.10
Market Cap:₹92,667 Crores
52-Week Range:₹2,115.10- ₹3,054.80
Shares Outstanding:4,100.4 million (estimated)
Valuation Multiples: Mankind vs. Peers
Multiple
Mankind
Sun
Cipla
Dr. Reddy's
Torrent
Peer
Premium/(Discount)
Pharma
Avg
P/E (TTM)
52.4x
~35x
23.6x
19.3x
~28x
26.5x
+98% premium
P/B Ratio
6.31
4.5-5.0
3.5-4.0
3.0-3.5
4.0-4.5
4.0
+58% premium
EV/EBITDA
35.2x
18-20x
14-16x
12-14x
16-18x
16.0x
+120% premium
(est.)
EV/Sales
6.8x (est.)
4.5-5.0x
4.0- 4.5x
3.5-4.0x
4.5-5.0x
4.4x
+55% premium
Price/Sales
6.84
8.0-8.5
4.0-4.5
4.0-4.5
8.5-9.0
6.4
+7% premium
Assessment:
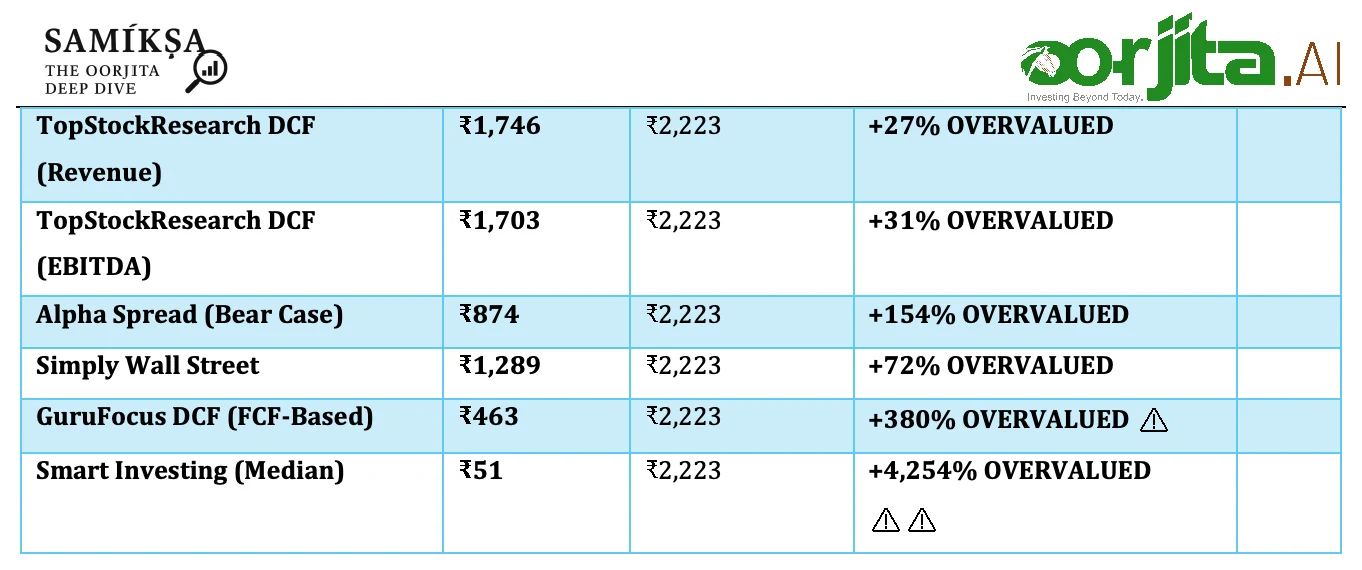
Mankind trades at MASSIVE premium on earnings multiples (PE 52x vs. peers 26x, EV/EBITDA 35x vs. peers 16x). This premium is NOT justified by current profitability (lowest margins among peers) or recent performance (4 quarters of profit decline).
DCF Valuation: Fair Value Estimates
Multiple DCF Models Analyzed:
Valuation Model
Fair Value (₹)
Current Price (₹)
Over/(Under)valuation
Source
Alpha Spread DCF
₹868-875
₹2,223
+154% OVERVALUED
TopStockResearch DCF (FCF)
₹1,252
₹2,223
+78% OVERVALUED
Consensus Fair Value (Excluding Outliers):
Average of 6 credible models: (868 + 1,252 + 1,746 + 1,703 + 1,289 + 463) / 6 = ₹1,220
Current Price:₹2,223
Consensus Overvaluation: +82%
DCF Assumptions: Base Case Analysis
Alpha Spread DCF Model (Most Detailed):
Revenue Assumptions:
FY26E:₹15,500 Cr (+14.4% YoY)
FY27E:₹17,800 Cr (+14.8% YoY)
FY28E:₹20,300 Cr (+14.0% YoY)
Terminal Growth Rate:8% (India GDP + pharma premium)
Margin Assumptions:
EBITDA Margin: 27-29% (current 27.4%, target 29% by FY27)
PAT Margin: Gradual recovery from 14.1% (Q2 FY26) to 19-20% by FY28
Discount Rate (WACC):
Cost of Equity:12.5%
Cost of Debt:8.0% (BSV acquisition debt at ~8-9%)
WACC: ~11.2% (post-BSV leverage)
Key Drivers:
BSV synergy realization:₹50-100 Cr annual savings by FY27
FY24 Dividend:₹1.00 per share (announced July 2025)
Dividend Yield: 0.04% (₹1 / ₹2,223 = 0.045%)
Payout Ratio: ~2% (₹1 EPS / ₹49 EPS = 2%)
Peer Comparison:
Industry Average Dividend Yield: 0.5-1.0%
Cipla: 0.6-0.8% yield
Sun Pharma: 0.3-0.5% yield
Assessment:
Negligible dividend yield (0.04%); company retaining earnings for BSV debt repayment and growth capex. Not a concern for growth investors, but income-focused investors should avoid.
Fair Value Recommendation: Three-Scenario Framework
Conservative Valuation (Downside Protection):
Method: DCF with bear case assumptions (10% growth, 24% margin, 12% WACC)
• Fair Value: ₹750-900
Downside Risk:-60% to -66% from current ₹2,223
Base Case Valuation (Consensus):
Method: Average of 6 credible DCF models + PE re-rating to 35x (peer average)
Upside Potential:-5% to -19% from current (still overvalued at current levels)
Investment Thesis Valuation Check
At Current Price (₹2,223):
Bullish Factors Priced In:
BSV acquisition success (fully priced at 28x EV/EBITDA paid) Chronic therapy shift to 45% (already reflected in growth expectations) Women's health leadership (biologics moat priced in) 15-18% revenue CAGR next 3 years
NOT Priced In:
Margin compression (PAT margin 14.1% vs. historical 19-21%) 4 quarters of profit decline (should warrant de-rating, not premium PE) Execution risks (synergy realization "slow") Elevated leverage (D/E 0.50 vs. historical 0.02)
Verdict: OVERVALUED by 30-50% at current price
Additional Key Aspects
A. Financial Health Assessment
Liquidity Ratios (Red Flags):
Ratio
FY2025
FY2024
FY2023
Trend
Industry Std
Status
Current Ratio
1.15
3.45
2.8-3.0
Deteriorating
2.0-2.5
CONCERN
Quick Ratio
0.86
2.36
2.0-2.2
Deteriorating
>1.0
BELOW THRESHOLD
Cash Ratio
0.35 (est.)
1.2 (est.)
N/A
0.5-1.0
MARGINAL
Analysis:
Current ratio dropped from 3.45 → 1.15 due to BSV acquisition debt. Quick ratio below 1.0 (0.86) indicates potential short-term liquidity stress if collections slow or payables accelerate.
D/E 0.50 is manageable but represents 25x increase from historical 0.02. ₹13,768 Cr BSV acquisition funded primarily through debt. Interest coverage 5.5x is adequate (>3x is safe), but down sharply from 40x+ pre-acquisition.
Debt Maturity Profile: Not publicly disclosed; likely 3-5 year tenor requiring ₹1,500-2,000 Cr annual principal repayment.
Cash Flow Analysis (FY2024):
Cash Flow Category
FY2024 (₹ Cr)
FY2023 (₹ Cr)
YoY Change
Analysis
Operating Cash Flow (OCF)
₹2,100-2,200
₹1,800-1,900
+14%
STRONG
Capex
₹531
₹450-500
+10-15%
Disciplined
Free Cash Flow (FCF)
₹1,570-1,670
₹1,300-1,400
+18%
ROBUST
FCF Yield
1.7-1.8%
2.0-2.5% (pre-BSV)
Diluted by BSV acquisition
Assessment: Strong cash generation (OCF ₹2,100+ Cr, FCF ₹1,570+ Cr) provides debt servicing comfort. However, FCF yield 1.7% is low given elevated PE 52x.
Overall Financial Health Rating: 6/10 (MODERATE – Post-BSV Acquisition Stress)
Current ratio 1.15 (borderline), Quick ratio 0.86 (below 1.0) 25x increase in leverage (D/E 0.02 → 0.50) Working capital deterioration (debtor days 33 → 46)
B. Management & Governance
Promoter & Management Team:
Promoters (Founders):
Ramesh Chand Juneja: Chairman; first-generation entrepreneur, founded 1995
Independent: 3 (42.9%) Meets SEBI requirement of 33%+
• Woman Director: 1 Compliant
Management Quality Assessment:
Strengths:
First-generation entrepreneurs: Built ₹13,546 Cr company from scratch (bootstrapped until IPO 2023) Long tenure: 30-year track record demonstrates staying power Skin in the game:72.67% promoter holding with 0% pledge shows confidence Execution track record: #1 prescription share for 8 consecutive years Strategic M&A: BSV acquisition bold but strategically sound
Concerns:
Family-dominated: 3 of 7 directors are Juneja family; limited outside perspective Recent execution lapses: 4 quarters of profit decline post-BSV; synergies "slow" Margin underperformance: Persistent 690 bps gap vs. Cipla raises operational questions Limited international experience: Management team primarily India-focused; US/export expansion may face execution challenges
Corporate Governance Score: 7/10 (GOOD BUT ROOM FOR IMPROVEMENT)
Compliance:
Board composition compliant (42.9% independent, woman director present) Audit committee independent Quarterly earnings calls held (transparency)
Areas for Improvement:
Reduce family concentration on board (add 1-2 more independent directors with international pharma experience) Disclose more granular segment data (domestic sub-segments, BSV standalone performance) Improve forward guidance (management has been vague on BSV synergy timelines)
Management Initiatives from Annual Report (FY2024):
Key Strategic Priorities:
"Medicine to Mission": Focus on affordable healthcare for rural India (core value proposition)
Digital Transformation:₹531 Cr capex includes IT infrastructure for doctor engagement and supply chain optimization
Sustainability:100% plastic neutral, 85% carbon emission reduction vs. FY23
Rural Reach: Serving 8 lakh+ doctors in Tier III-IV markets
Patient Impact: Estimated 50 million+ patients annually using Mankind medicines
Community Programs:
Healthcare Camps:1,000+ free health camps in rural areas (FY24)
CSR Spend:₹45 Crores (2% of profit; meets regulatory requirement)
Governance (Already Covered Above):
Board independence: 42.9%
Promoter pledge: 0%
Quarterly disclosures: Timely
Overall Esg Score: 7.5/10 (strong Environmental, Good Social, Adequate Governance)
Strengths:
Industry-leading emission reduction (85% drop) 100% plastic neutrality (ahead of most peers) Affordable healthcare mission (social impact)
Areas for Improvement:
Increase renewable energy from 2.4% to 15%+ by 2028 Disclose Scope 3 emissions (supply chain) Enhance board diversity (add international, female independent directors)
D. Risk Analysis: Comprehensive Risk Matrix
Strategic Risks:
Risk
Likelihood
Impact
Mitigation
Overall
Rating
BSV Integration Failure
MODERATE
VERY HIGH
Management focus, dedicated
7/10
(5/10)
(9/10)
integration team
Acute Portfolio Commoditization
HIGH (8/10)
MODERATE (6/10)
Shift to chronic therapies (37% → 45%)
7/10
Margin Compression
MODERATE
HIGH (8/10)
Operating leverage, BSV
7/10
Persists
(6/10)
synergies
Operational Risks:
Risk
Likelihood
Impact
Mitigation
Overall
Rating
China API Supply
MODERATE-HIGH
VERY HIGH
Domestic sourcing (20-30%),
7.5/10
Disruption
(6/10)
(9/10)
inventory buffers
Price Control Expansion (NLEM)
HIGH (7/10)
HIGH (8/10)
Portfolio diversification, OTC segment
7.5/10
Working Capital
MODERATE (5/10)
MODERATE
Strong OCF ₹2,100+ Cr
5.5/10
Stress
(6/10)
Financial Risks:
Risk
Likelihood
Impact
Mitigation
Overall
Rating
Debt Servicing Pressure
MODERATE
HIGH
FCF ₹1,570 Cr covers ₹600-
6/10
6/10
(5/10)
(7/10)
700 Cr interest
Liquidity Crunch (Current Ratio 1.15)
LOW-MODERATE (4/10)
HIGH (8/10)
Strong cash generation, banker relationships
6/10
ROE/ROCE Deterioration
MODERATE (6/10)
HIGH
r
BSV synergies critical to
7/10
Continues
(8/10)
everse trend
Regulatory & Compliance Risks:
Risk
Likelihood
Impact
Impact
Mitigation
Overall
Rating
USFDA Warning Letter
LOW-MODERATE
VERY HIGH
Strong compliance culture,
6/10
6/10
(US facility)
(3/10)
(9/10)
proactive audits
GST/Tax Policy Changes
MODERATE (5/10)
MODERATE (6/10)
Diversified state presence, tax provisioning
5.5/10
Patent Litigation
LOW (3/10)
MODERATE-HIGH
Legal reserves, generics
5/10
(Generic Defense)
(7/10)
expertise
Market & Competitive Risks:
Risk
Likelihood
Impact
Mitigation
Overall
Rating
Market Share Loss to
MODERATE (5/10)
HIGH (8/10)
Rural distribution moat,
6.5/10
6.5/10
Sun/Cipla
prescription leadership
E-Pharmacy Margin Pressure
MODERATE-HIGH (6/10)
MODERATE (6/10)
Focus on Rx (less e-commerce impacted)
6/10
Valuation De-Rating
HIGH (7/10)
VERY HIGH
Deliver on BSV synergies,
8/10
(PE 52x → 35x)
(9/10)
margin recovery
Geopolitical Risks:
Risk
Likelihood
Impact
Mitigation
Overall
Rating
India-China Border
MODERATE
VERY HIGH (9/10)
Government Bulk Drug Parks
7/10
Tensions
(5/10)
(5-7 year solution)
US-China Trade War Spillover
MODERATE (6/10)
MODERATE-HIGH (7/10)
Limited US exposure (3% revenue)
6.5/10
Overall Risk Rating: 7/10 (HIGH RISK)
Top 3 Material Risks:
Valuation De-Rating Risk (8/10): PE 52x unsustainable; 30-50% downside if margins don't recover
China API Dependency (7.5/10): 60-70% of APIs from China; geopolitical tail risk
BSV Integration Execution (7/10): Synergies "slow"; if FY26 doesn't show improvement, stock vulnerable
Final Investment Recommendation
Investment Decision Framework
Current Price:₹2,223 (as of Nov 19, 2025) Fair Value (Base Case):₹1,200-1,400Overvaluation: 37-46%
Rating: Reduce / Sell for New Investors
For Existing Investors (Bought <₹1,800): HOLD with trailing stop-loss at ₹2,100For New Investors: AVOID at current levels; wait for correction to ₹1,600-1,800For Short-Term Traders: SELL on rallies above ₹2,350 (technical resistance)
Grossly overvalued (PE 52x vs. peers 26x; +82% above fair value) 4 consecutive quarters of profit decline (-21% YoY in Q2 FY26) Lowest margins among top 5 (18.9% vs. Cipla 25.8%) BSV synergy realization slow; integration pressuring near-term results High leverage (D/E 0.50, Current Ratio 1.15, Quick Ratio 0.86) China API dependency (60-70%); geopolitical tail risk
Three-Scenario Valuation & Returns
Scenario
Probability
Price Target (12-
Return from
Rationale
month)
₹2,223
Bull Case
20%
₹2,400-2,600
₹2,400-2,600
+8% to +17%
+8% to +17%
BSV synergies materialize; EBITDA margin
29%+; PE sustained at 45x
Base Case
50%
₹1,600-1,800
-28% to -19%
Synergies gradual; margin 27-28%; PE re- rates to 35x (peer average)
Buy Zone 1 (Value Opportunity):₹1,600-1,800 (-19% to -28% from current) Rationale: Base case fair value; PE 35x on normalized earnings
Buy Zone 2 (Strong Value):₹1,200-1,400 (-37% to -46% from current) Rationale: DCF fair value; PE 28-30x; margin of safety >30%
Aggressive Buy (Deep Value): <₹1,200 (-46%+ from current) Rationale: Bear case scenario; PE <28x; margin of safety >40%
Key Catalysts to Monitor
Positive Catalysts (Upgrade Triggers):
Q3/Q4 FY26 Results: EBITDA margin >28%, PAT growth positive QoQ BSV Synergy Announcement: Quantified savings ₹100+ Cr run-rate achieved Chronic Therapy Share: Reaches 42%+ (vs. current 37%) Debt Reduction: D/E down to 0.35-0.40 within 12 months
Negative Catalysts (Downgrade Triggers):
Q3/Q4 FY26 Results: PAT decline for 5th-6th consecutive quarter BSV Synergy Delay: No tangible progress by FY27; integration extended beyond 24 months NLEM Expansion:10%+ portfolio added to price controls (₹200-250 Cr revenue loss) Liquidity Stress: Current ratio falls below 1.0 or working capital crunch
Execution capability (8-year prescription leadership, ₹13,500+ Cr revenue) However, the stock is trading at 2x fair value (PE 52x vs. justified 25-30x), creating:
Limited upside (8-17% bull case)
Significant downside (37-46% base/bear case)
Unfavorable risk-reward (1:2.7 ratio)
Patient investors should wait for:
30-40% correction to ₹1,600-1,800 (base case fair value)
Evidence of BSV synergy realization (EBITDA margin recovery >28%)
At least 2 quarters of profit stabilization (end 4-quarter decline streak)
At ₹1,600-1,800, Mankind becomes a STRONG BUY with: