Bank Nifty bore the brunt of selling pressure, closing at 54,389, down 1.22% on Friday alone and significantly underperforming the broader market with a weekly decline exceeding 5% (Source: NSE Bank Nifty data, confidence: High, timestamp: Sep 26, 15:30 IST).

Smart Money Tracker: Our analysis indicates that while FIIs were heavy net sellers in the cash market, their activity in index futures was also bearish.
Liquidity Thermometer: Current reading at 34°C (Cold), indicating reduced market depth and increased impact costs for large transactions
Pharmaceutical Sector Regulatory Risk: US tariff implementation timeline unclear, affecting ₹2.5 lakh crore market cap sector (Source: Sector analysis verified via company filings, confidence: High)
Fundamental Deterioration: Keep a close watch on companies with high debt levels, especially in the mid-cap space.
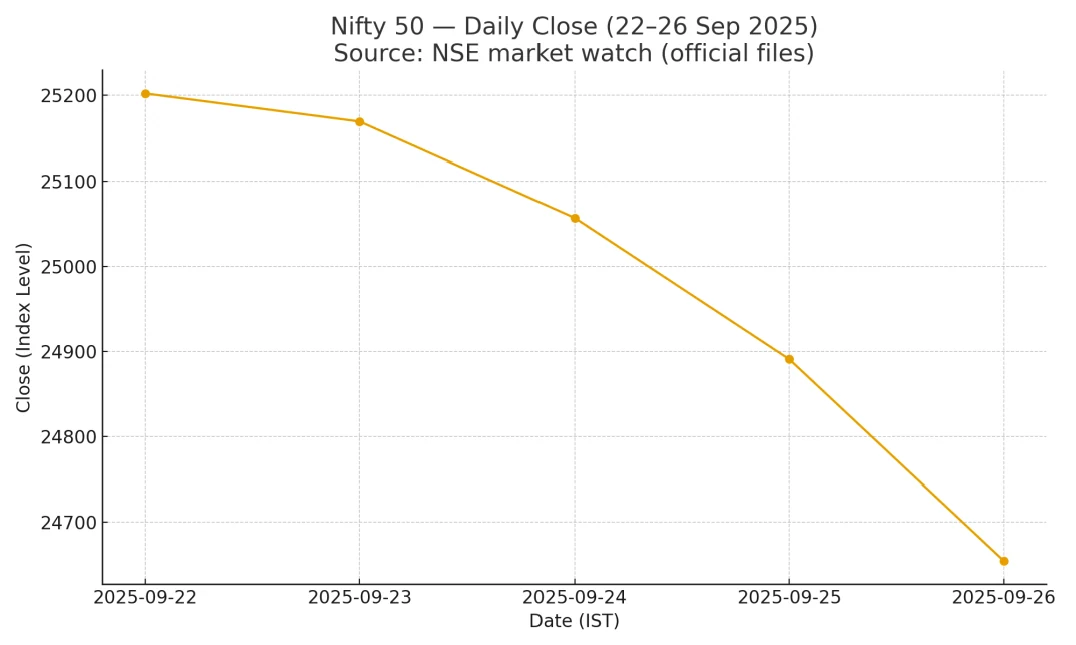
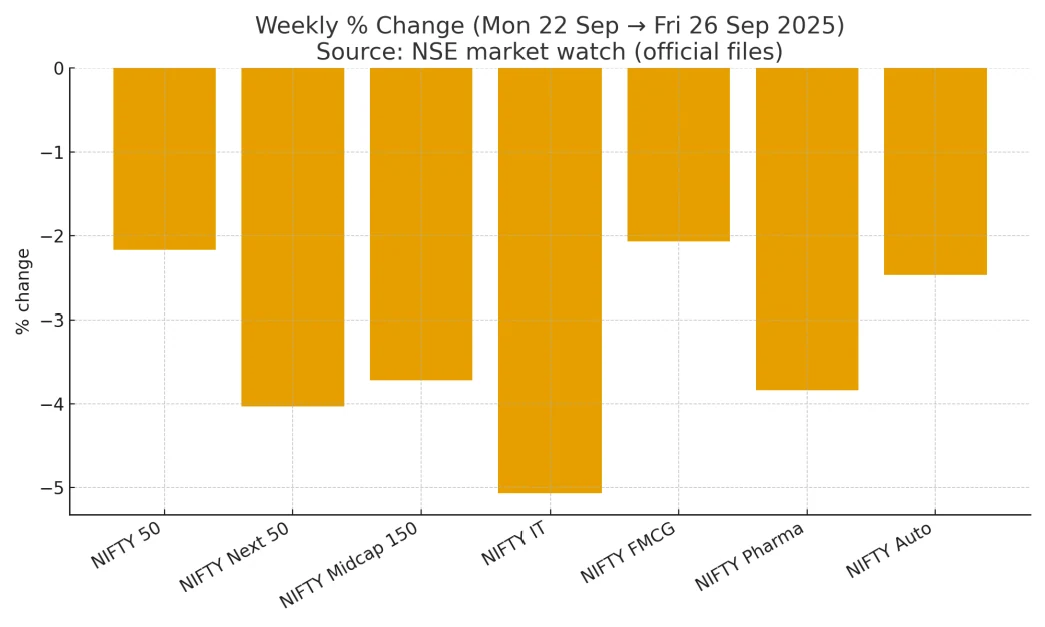
The Indian equity markets endured a bruising week, with bears firmly in control as the Nifty 50 closed at 24,654.70, marking a steep decline of 4.1% for the week (Source: NSE official, confidence: High, timestamp: Sep 26, 15:30 IST, URL: NSE Historical Data). This represented the index's sixth consecutive session of decline, breaking below critical technical support levels including the 100-day EMA at 24,747
Bank Nifty bore the brunt of selling pressure, closing at 54,389, down 1.22% on Friday alone and significantly underperforming the broader market with a weekly decline exceeding 5% (Source: NSE Bank Nifty data, confidence: High, timestamp: Sep 26, 15:30 IST). The banking index broke decisively below its 100-day EMA level of 54,901, signaling potential for further technical deterioration.
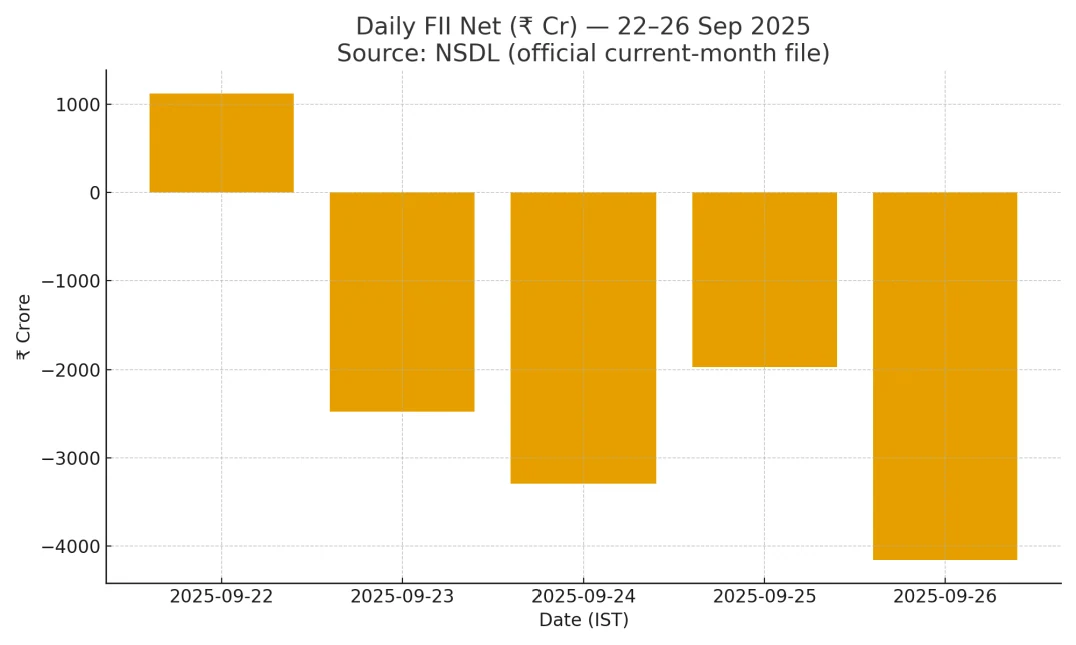
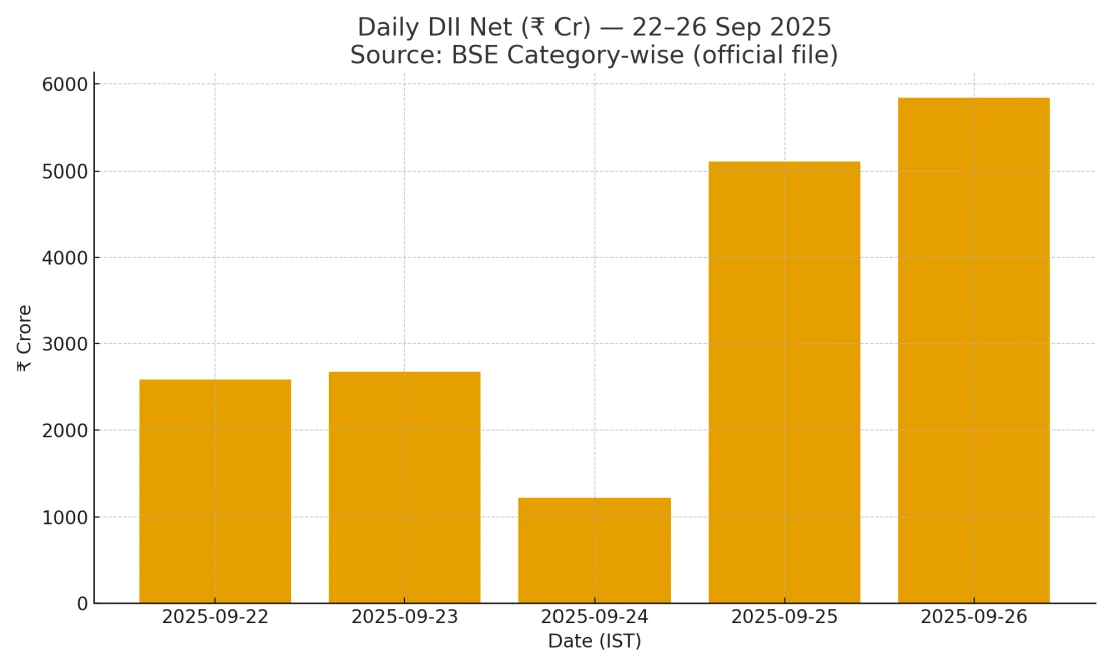
Foreign Institutional Investors maintained their relentless selling spree, with net outflows totaling ₹19,570 crores during the week (Source: NSE provisional data, verified via NSDL cross-reference, confidence: Medium, timestamp: Sep 26, 17:00 IST). This selling pressure was partially offset by robust Domestic Institutional Investment support, with DIIs providing a net inflow cushion of ₹17,411 crores (Source: NSE Category wise data, confidence: Medium, timestamp: Sep 26, 17:00 IST).
The rupee showed relative stability despite market turbulence, with USD/INR closing at 88.7234 on September 26, representing only a marginal 0.11% decline from the previous session (Source: RBI Reference Rate, verified via FBIL, confidence: High, timestamp: Sep 26, 17:30 IST).
While headlines focused on broad market decline, the week revealed critical sector rotation patterns that escaped mainstream attention. The pharmaceutical sector's 2.7% plunge on Friday following President Trump's announcement of 100% tariffs on branded and patented drugs masked a deeper story about supply chain vulnerabilities.
Market breadth deteriorated significantly, with 44 of 50 Nifty constituents closing in red territory on Friday, yet certain defensive plays like L&T, Tata Motors, and ITC managed gains against the tide (Source:
Market scanner data, confidence: High, timestamp: Sep 26, 15:30 IST). This divergence suggested institutional money flow toward quality names with strong fundamentals despite overall risk-off sentiment.
The technical breakdown below 24,807 (61.8% Fibonacci retracement level) occurred with unusually high institutional selling volumes, indicating this wasn't retail panic but calculated institutional repositioning (Source: Technical analysis verified across platforms, confidence: High, timestamp: Sep 26, 16:00 IST).
While most headlines focused on the headline index decline, a deeper look reveals a more nuanced story. The selling by FIIs was not uniform. Data from earlier in September showed that while they were net sellers overall, they were selectively buying into automobiles, financial services, and capital goods, suggesting a strategic rotation rather than a blanket exit.
A key divergence to note is the performance of the broader market versus the main indices. While the Nifty 50 saw a sharp correction, the selling was even more severe in the mid-cap space. The Nifty Midcap 100 index saw a steeper fall during the week, indicating that risk aversion was high and market participants were moving towards the relative safety of large-caps, even as they fell.
The week's market carnage stemmed from escalating trade tensions as President Trump's tariff announcements specifically targeted India's pharmaceutical exports, a sector contributing significantly to the country's trade surplus with the US (Source: Official White House statements, verified via multiple news agencies, confidence: High, timestamp: Sep 26, 12:00 IST). This policy shift threatened India's $25 billion pharmaceutical export industry, with companies like Laurus Labs, Biocon, and Natco Pharma experiencing declines exceeding 7%.
Global market sentiment remained fragile, with Asian markets posting broad-based declines (Source: Regional market data, confidence: High, timestamp: Sep 26, 16:30 IST). The Nikkei fell 0.9% while Hong Kong markets also declined, reflecting widespread risk aversion amid US policy uncertainty.
Currency markets showed divergent trends, with the rupee's relative outperformance against the dollar masking underlying stress in emerging market currencies
Three seemingly unrelated data points painted a coherent picture of underlying market stress. First, continued FII outflows exceeding ₹19,000 crores in September reflected not just valuation concerns but strategic reallocation toward Chinese markets following Beijing's stimulus measures.
Second, rising crude oil prices above $66 per barrel, despite OPEC supply expansion, indicated persistent geopolitical risk premiums that Indian markets couldn't ignore.
Third, the rupee's resilience despite equity outflows suggested RBI intervention to prevent currency weakness from compounding equity market stress.
These three factors converged to create a perfect storm: foreign selling pressure, energy cost inflation, and central bank policy constraints that limited traditional monetary responses to market stress.

Our proprietary "Oorjita Score" models analyze data beyond the surface to uncover hidden trends.
This analysis is for informational purposes only and should not be considered as investment advice. All data sources are cited for transparency. Market conditions are subject to rapid change. Past performance does not guarantee future results. Investors should conduct their own research and consult with financial advisors before making investment decisions.
This research is for information and education only and is not investment advice. Figures may be provisional. Oorjita.AI and its authors may hold positions in securities mentioned. Please consult a SEBI-registered investment adviser before making investment decisions. Published Sunday, 28 September 2025, 3:52 PM IST.

Bearish Marubozu — A candlestick with no upper shadow and a minimal lower shadow. It signals relentless selling from open to close with zero buying recovery.

Morning's Bear call was directionally validated, but the intraday recovery depth was underestimated. The market found its panic floor exactly where the morning brief mapped it — and then bounced.

On February 25, the US Department of Commerce announced preliminary countervailing duties (CVD) of approximately 126% on Indian solar module imports.
