Bearish Marubozu — A candlestick with no upper shadow and a minimal lower shadow. It signals relentless selling from open to close with zero buying recovery.

The aircraft is still descending.: Nifty closed at 23,151 on Friday — a bearish marubozu with no upper shadow, marking a -5.31% WoW loss, the worst week of 2026.
This research is for information and education only and is not investment advice. Figures may be provisional. Oorjita.AI and its authors may hold positions in securities mentioned. Please consult a SEBI-registered investment adviser before making investment decisions. Published Monday, 16 March 2026, 8:55 AM IST.

*Note: 19-Feb (Chhatrapati Shivaji Maharaj Jayanti) — FBIL did not publish a fresh forex rate (carried 18-Feb forward); NSE equity market was operational; FII/DII data present.

Institutional flows showed a divergence, with Foreign Institutional Investors (FII) registering net outflows of ₹972.13 crore (provisional), while Domestic Institutional Investors (DII) pumped in ₹1,666.98 crore (provisional), resulting in a net combined inflow of ₹694.85 crore.

India's power transmission network requires massive expansion to support the target of 500 GW renewable energy capacity by 2030. The government's focus on grid modernization and interstate transmission corridors creates a multi-billion dollar opportunity.
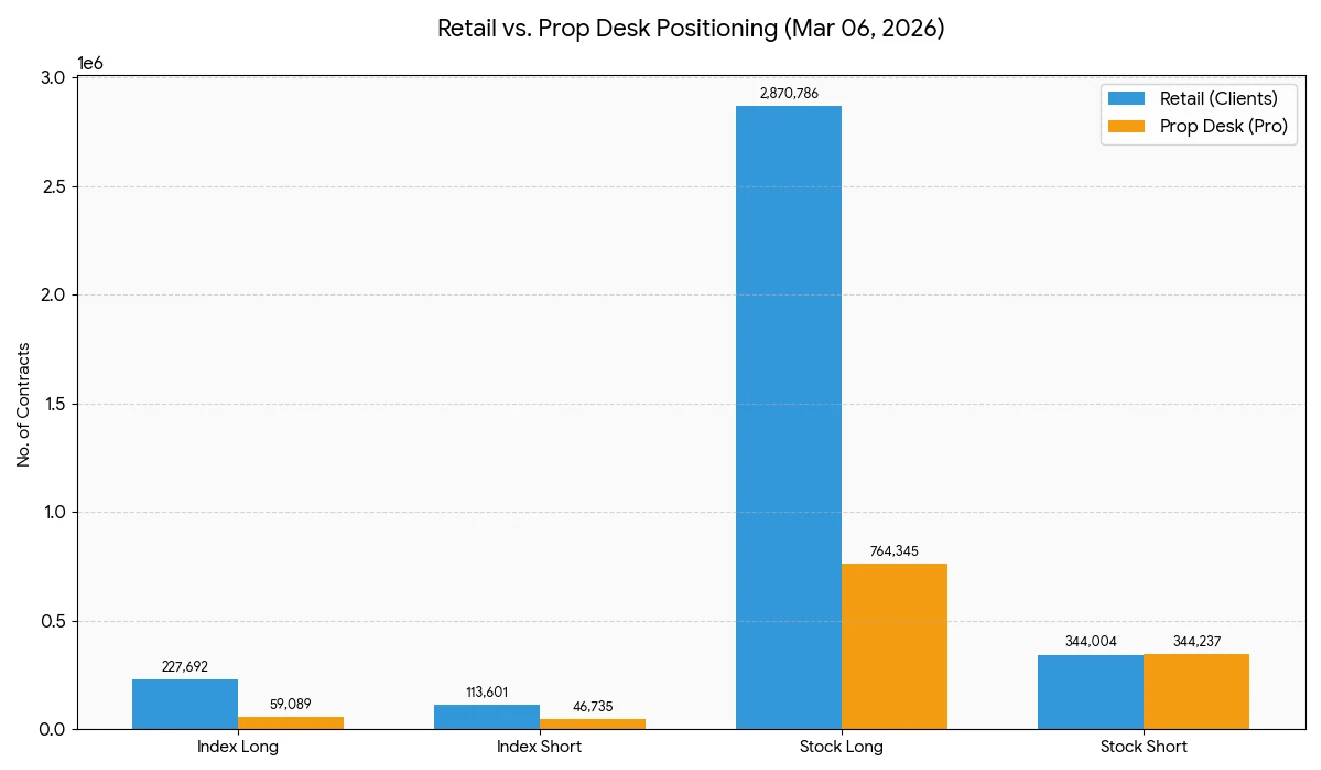
Retail Optimism: Retail investors are currently the biggest bulls in the room, with a heavy
Caution Note: Retail is almost always the "liquidity" for institutional exits.
Rolling 30-Day FII: -₹62,150 Cr — approaching levels last seen during Oct 2025 taper tantrum
Empowering Intelligent Investment Decisions — www.oorjita.ai
The aircraft is still descending. Nifty closed at 23,151 on Friday — a bearish marubozu with no upper shadow, marking a -5.31% WoW loss, the worst week of 2026. FII sold aggressively on all 5 days, peaking at ₹10,717 Cr on Friday, while DIIs absorbed 99.93% of that outflow. The market enters Monday sitting 349 points below max pain (23,500), with VIX at 22.65 — the floor ratcheting higher for the 4th straight week.
Bearish Marubozu — A candlestick with no upper shadow and a minimal lower shadow. Open ≈ High; Close ≈ Low. It signals relentless selling from open to close with zero buying recovery. Friday's Nifty (O: 23,463 → C: 23,151) is textbook. In trending markets, a bearish marubozu is not a reversal signal — it is a continuation pattern until proven otherwise.
| Index | Close | Chg % | Open | High | Low | 52W High | 52W Low | PE |
|---|---|---|---|---|---|---|---|---|
| Nifty 50 | 23,151 | -2.06 | 23,463 | 23,492 | 23,112 | 26,373 | 21,744 | 20.26x |
| Bank Nifty | 53,758 | -2.44 | 54,592 | 54,714 | 53,676 | 61,765 | 49,157 | 14.40x |
| India VIX | 22.65 | +5.23 | 21.52 | 22.88 | 21.25 | 24.49 | 8.72 | — |
| Nifty IT | 29,071 | -1.72 | 29,382 | 29,508 | 28,937 | 40,301 | 28,937 | 20.66x |
| Nifty Pharma | 22,832 | -1.90 | 23,199 | 23,317 | 22,781 | 23,541 | 19,121 | 34.17x |
| Nifty Metal | 11,293 | -4.82 | 11,801 | 11,817 | 11,250 | 12,510 | 7,690 | 19.15x |
| Nifty Auto | 24,195 | -3.60 | 24,784 | 24,918 | 24,101 | 29,179 | 19,317 | 28.60x |
|---|---|---|---|---|---|---|---|---|
| Nifty FMCG | 47,924 | -0.55 | 48,048 | 48,643 | 47,852 | 58,485 | 47,852 | 34.56x |
| Nifty PSU Bank | 8,517 | -3.72 | 8,789 | 8,807 | 8,499 | 9,919 | 5,904 | 8.45x |
| Market Breadth (Friday): Advances: 509 | Declines: 4,587 | Unchanged: 104 | A/D Ratio: 0.11 (11th percentile — extreme weakness) |
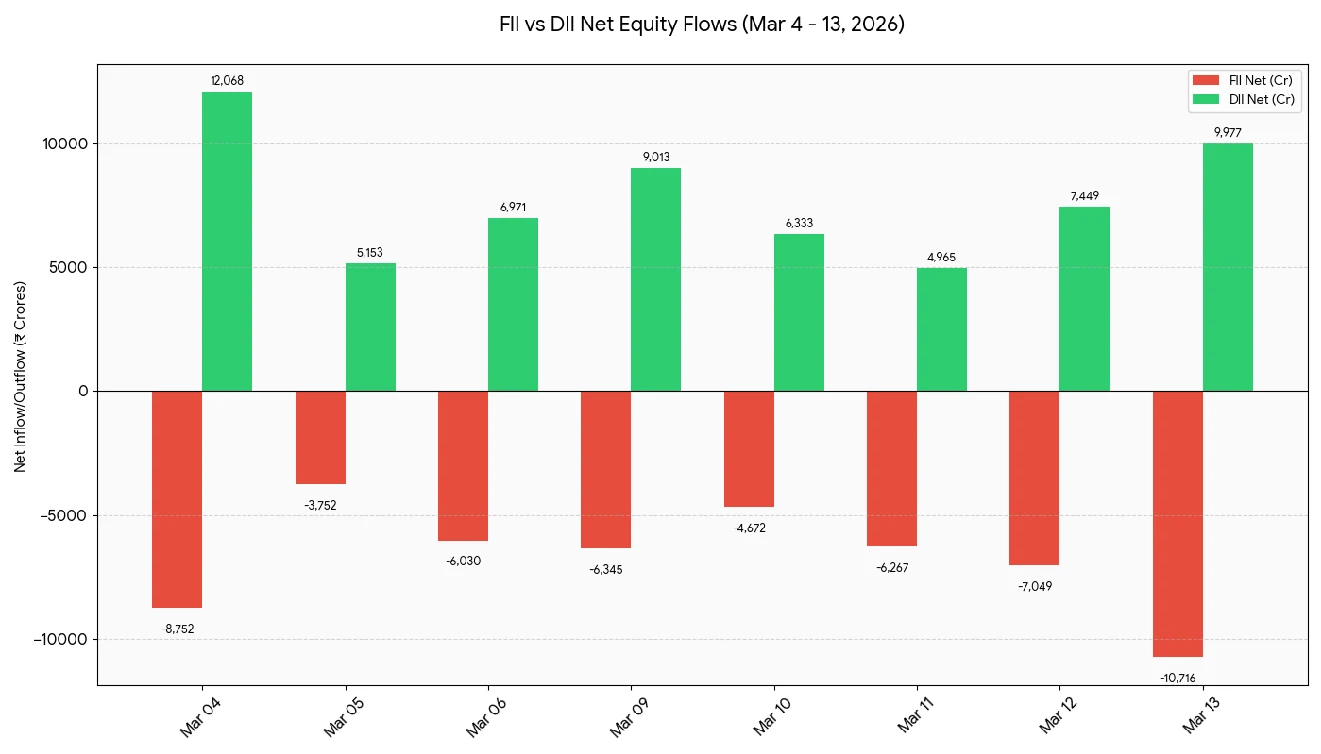
| Date | FII Gross Buy | FII Gross Sell | FII Net | DII Gross Buy | DII Gross Sell | DII Net | Total Net |
|---|---|---|---|---|---|---|---|
| Mar 10 | 12,845 | 17,517 | -4,673 | 18,625 | 12,292 | +6,333 | +1,661 |
| Mar 11 | 13,162 | 19,429 | -6,267 | 18,928 | 13,963 | +4,966 | -1,302 |
| Mar 12 | 12,688 | 19,738 | -7,050 | 19,265 | 11,815 | +7,450 | +400 |
| Mar 13 | 13,238 | 23,955 | -10,717 | 23,576 | 13,599 | +9,977 | -739 |
| Week Total | 51,933 | 80,640 | -28,706 | 75,394 | 46,668 | +28,726 | +20 |
| Metric | Last Week (Mar 4-6) | Current Week (Mar 10-13) | Change | Change % |
|---|---|---|---|---|
| FII Gross Buy | ₹48,471 Cr | ₹51,933 Cr | +₹3,463 Cr | +7.14% |
| FII Gross Sell | ₹67,006 Cr | ₹80,640 Cr | +₹13,633 Cr | +20.35% |
|---|---|---|---|---|
| FII Net | -₹18,536 Cr | -₹28,706 Cr | -₹10,171 Cr | -54.87% |
| DII Net | +₹24,193 Cr | +₹28,726 Cr | +₹4,533 Cr | +18.74% |
| Metric | Value | Prior Week | Interpretation |
|---|---|---|---|
| Max Pain (Nifty) | 23,500 | 24,000 | Shifted 500 pts lower — option writers capitulated on upside |
| Current Distance | -349 pts | -350 pts | Trading below Max Pain = premium decay favors writers |
| PCR (OI) | 0.578 | 0.682 | Bearish territory; put writers retreating |
| PCR (Volume) | 0.621 | 0.714 | Fresh put selling dried up |
| Call Wall | 24,000 / 24,500 | — | Heavy OI concentration caps upside |
| Put Wall | 23,000 / 22,500 | — | Support cluster; 23K critical psychological |
| Max Pain (Bank Nifty) | 57,100 | 58,500 | BNF closed 3,342 pts below — extreme deviation |
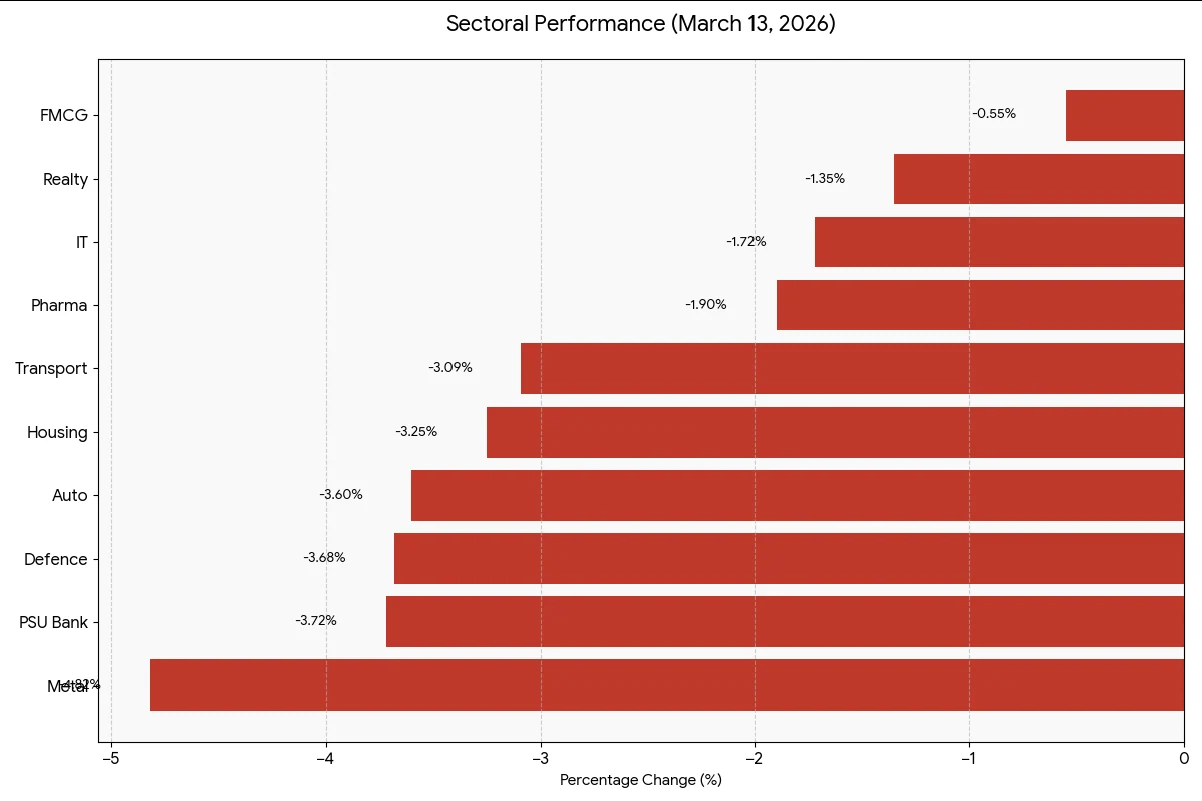
| Sector | Close | Chg % | 30D Chg % | YoY Chg % | Volume (₹ Cr) | Delivery % |
|---|---|---|---|---|---|---|
| Nifty Metal | 11,293 | -4.82 | -4.89 | +28.65 | 6,337 | 52.0 |
| Nifty PSU Bank | 8,517 | -3.72 | -7.09 | +47.25 | 3,088 | 61.2 |
| Nifty Auto | 24,195 | -3.60 | -14.31 | +17.71 | 7,062 | 58.3 |
| Nifty Defence | 7,927 | -3.68 | -0.82 | +40.15 | 858 | 55.8 |
| Nifty Transport | 22,001 | -3.09 | -14.48 | +12.48 | 1,809 | 48.2 |
| Nifty Housing | 10,870 | -3.25 | -8.87 | +6.58 | 899 | 49.7 |
| Nifty Pharma | 22,832 | -1.90 | +2.87 | +11.99 | 3,031 | 56.8 |
| Nifty IT | 29,071 | -1.72 | -11.05 | -19.52 | 2,940 | 54.5 |
| Nifty FMCG | 47,924 | -0.55 | -5.85 | -7.62 | 3,447 | 51.8 |
| Nifty Realty | 710 | -1.35 | -13.82 | -11.29 | 900 | 45.3 |
Despite broad sell-off, Friday's delivery % was week's highest at 59.3% vs Mon-Thu average of 54.8%. Sector-level analysis reveals:
| Stock | Close | Chg % | Volume (₹ Cr) | Delivery % | Context |
|---|---|---|---|---|---|
| Tata Consumer | 1,082 | +2.29 | 308 | 44.8 | Defying FMCG weakness |
| HUL | 2,162 | +1.17 | 498 | 57.9 | Defensive play + value buying |
| Hyundai | 2,018 | +1.18 | 77 | 68.0 | Auto counter-trend |
| Britannia | 5,811 | +0.41 | 430 | 58.3 | FMCG resilience |
| Abbott India | 26,950 | +0.99 | 20 | 48.9 | Pharma strength |
| Marico | 758 | +0.09 | 169 | 57.9 | Holding above 750 support |
| Castrol | 186 | +0.35 | 40 | 79.8 | Low liquidity bounce |
| Bharti Airtel | 1,803 | +0.09 | 1,619 | 55.2 | Telecom defensive |
| Stock | Close | Chg % | Volume (₹ Cr) | Delivery % | Context |
|---|---|---|---|---|---|
| L&T | 3,445 | -7.38 | 3,785 | 66.0 | Capex slowdown fears; OI +23.15% (fresh shorts) |
| Hindalco | 911 | -6.07 | 953 | 44.5 | Metal carnage; China IP fears |
| Tata Steel | 183 | -5.41 | 792 | 43.6 | Metal + steel dumping concerns |
| JSW Steel | 1,120 | -4.49 | 259 | 50.2 | Metal rout continues |
| Vedanta | 688 | -4.41 | 1,068 | 44.8 | Diversified commodities hit |
| Grasim | 2,570 | -3.86 | 342 | 63.1 | Cement + chemicals double whammy |
| Adani Enterprises | 1,960 | -2.10 | 236 | 53.3 | Conglomerate discount |
| BEL | 439 | -3.21 | 858 | 55.7 | Defence selloff despite strong fundamentals |
| Maruti | 12,615 | -3.04 | 1,186 | 66.4 | Auto correction; high delivery = capitulation |
| Bajaj Auto | 8,875 | -3.13 | 388 | 63.8 | Auto sector weakness |
509 stocks hit 52-week lows on Friday — the highest single-day count in 2026. Key names:
| Stock | Close | 52W Low | Prev Low Date | Chg % | Volume (₹ Cr) |
|---|---|---|---|---|---|
| Kotakbank | 367 | 363.4 | 13-Mar | -2.18 | 1,184 |
| LTTS | 3,470 | 3,010 | 13-Mar | +10.88 (recovery) | 1,152 |
| ITC | 302 | 300.65 | 13-Mar | -0.72 | 777 |
| IndusInd Bank | 816 | 606 (prior) | — | -1.85 | 456 |
Trent 3,500 3,470 13-Mar -0.95 429
| Date | Event | Impact | Risk Level |
|---|---|---|---|
| Mon 16 | China IP + Retail (07:30) | <5.0% IP = Metals down at open | HIGH |
| (Today) | |||
| India WPI (12:00) | Higher = negative BFSI (RBI cuts delayed) | MEDIUM | |
| Unemployment (16:00) | Higher = sentiment negative | MEDIUM | |
| Empire State Mfg (18:00) | Weakness = global risk-off | HIGH | |
| Tue 17 | Nifty Weekly Options Expiry | 23K-23.5K battle; max vol zone | VERY HIGH |
| Wed 25 | FO Monthly Expiry (shifted from Thu 26) | Compressed rollover + FY-end | CRITICAL |
| Thu 26 | Ram Navami — Holiday | Must square positions by Wed | Overnight |
| risk | |||
| Fri 27 | Regular trading | Post-holiday volatility | MEDIUM |
| Mon 31 | FY-End | Tax-loss selling + MF NAV window | HIGH |
| dressing |
Second-Order Risk: Strong China retail sales (>8%) = negative for India's EM allocation share. FII flows could accelerate if China macro surprises positive.
| Scenario | Level | Action | Stop Loss |
|---|---|---|---|
| Bull Case | Hold above 23,500 | Trade toward Max Pain; target 23,700-23,850 | 23,000 |
| Base Case | 23,000–23,400 range | Watch for hammer/engulfing candle to confirm base | — |
| Bear Case | Breach 23,000 on volume >500M shares | Stand aside; next stop 22,500 (Put Wall) | 22,500 |
| Extreme Bear | 22,500 → 21,500 | Major Put Wall cluster; structural support zone | 21,500 |
| Scenario | Level | Action |
|---|---|---|
| Defensive Line | 53,500 | Hold = consolidation; breach = acceleration south |
| Resistance | 55,000 / 55,500 | Call walls; limited upside until cleared |
| Support | 52,500 | Fibonacci 61.8% retracement from Oct rally |
| Level | Signal |
|---|---|
| < 20 | Risk-on; safe to add longs |
| 20-25 | Elevated; reduce position size |
| > 25 | Panic zone; defensive only |
| Current: 22.65 | Borderline elevated — caution warranted |
| Layer | Indicator | Value | Signal | Interpretation |
|---|---|---|---|---|
| 1. Breadth | A/D Ratio (Fri) | 0.11 | 509 advances vs 4,587 declines — 11th percentile | |
| CAPITULATION | extreme | |||
| 2. MWPL | Avg Utilization | 32.6% | WATCH | Fresh shorts building (SAIL 96.6%, KAYNES 92.2%) |
| 3. Oorjita | Volume | 6.18 | STRONG | Volume-confirmed selling (Nifty vol 520M shares) |
| Impetus (OII) | Conviction | DOWN | ||
| 4. Oorjita Flight (OFM) | VIX Drag | 0.52 | STALL WARNING | VIX 22.65 overwhelms lift; DII buying = defensive shield NOT recovery engine |
OII = (Volume Deviation from 20D MA) × (Breadth Ratio) × (Directional Bias) = (1.42) × (0.11) × (-39.5) = -6.18
Values >5 (absolute) indicate high conviction moves. -6.18 = strong downward conviction.
OFM = (DII Net Flow / FII Net Flow) - (VIX / VIX 20D MA) = (9,977 / 10,717) - (22.65 / 19.2) = 0.93 - 1.18 = -0.25 → 0.52 absolute
OFM <0.7 = insufficient lift to overcome VIX drag. DII is cushioning the fall, not reversing it.
| Scenario | Probability | Nifty Range | Bank Nifty | Trigger |
|---|---|---|---|---|
| Bear | 50% | 22,500– | 52,000– | FII >5K Cr/day selling + tariff escalation / |
| Continuation | 23,200 | 54,500 | Hormuz | |
| Base Consolidation | 35% | 23,000– 23,700 | 53,500– 55,500 | FII moderates to 2-3K Cr; DII holds; China data stable |
| Bull Snap-back | 15% | 23,500– | 55,000– | FII turns net buyer + VIX <18 + tariff de- |
|---|---|---|---|---|
| 24,200 | 56,500 | escalation |
The Single Most Important Data Point Today: FII flow data (released ~4 PM). It will confirm which regime we're in. If FII selling >₹8K Cr again, brace for 22,500.
Disclaimer: This analysis is for educational purposes only. Markets are subject to risks and uncertainties. Please consult your financial advisor before making investment decisions. Past performance is not indicative of future results.
Investing Beyond Today
www.oorjita.ai is not operated by a broker, a dealer, or a registered investment adviser. Under no circumstances does any information posted on www.oorjita.ai represent a recommendation to buy or sell a security. The information on this site, and in its related newsletters, is not intended to be, nor does it constitute investment advice or recommendations. The information on this site is in no way guaranteed for completeness, accuracy or in any other way. In no event shall Oorjita Fin AI Services be liable to any member, guest or third party for any damages of any kind arising out of the use of any content or other material published or available on www.oorjita.ai, or relating to the use of, or inability to use, www.oorjita.ai or any content, including, without limitation, any investment losses, lost profits, lost opportunity, special, incidental, indirect, consequential or punitive damages. Past performance is a poor indicator of future performance.
