Wall Street's Warning Signals: What Indian Investors Really Need to Know
Every market cycle feels different when you're living through it, until it ends the same way it always has. Right now, Wall Street's most respected institutions are raising red flags about valuations, liquidity structures, and recession risks.
MK
Dr. Murali KalyanaramanGlobal CFO · 30+ years in corporate finance · Chartered Accountant (ICAI) · 22 min read
This research is for information and education only and is not investment advice. Figures may be provisional. Oorjita.AI and its authors may hold positions in securities mentioned. Please consult a SEBI-registered investment adviser before making investment decisions. Published Friday, 24 October 2025, 2:36 PM IST.
Every market cycle feels different when you're living through it, until it ends the same way it always has. Right now, Wall Street's most respected institutions are raising red flags about valuations, liquidity structures, and recession risks. Bank of America reports that 60% of their proprietary bear market indicators are flashing red—dangerously close to the 70% threshold that has historically preceded major corrections. JP Morgan's analysis shows the S&P 500 trading at 21 times forward earnings, roughly 35% above historical norms. Meanwhile, Warren Buffett's favorite metric—the market cap-to-GDP ratio—has hit an unprecedented 217%, more than double the economy's actual output.
For Indian investors, this isn't just academic analysis of distant American markets. History shows that when Wall Street sneezes, emerging markets catch pneumonia. The January-February 2025 correction already demonstrated this: foreign portfolio investors yanked out over ₹64,000 crore, triggering a 9% Nifty drop. With the US accounting for 18% of India's exports and President Trump doubling tariffs on Indian goods to 50%, the transmission channels are wide open.
But here's the paradox: American corporations are buying back their own shares at a record $1.1 trillion pace in 2025. Earnings remain solid. The economy shows "weak but stable" conditions rather than collapse. So are we heading for disaster, or is this time actually different?
This report cuts through the noise to give you the facts, the risks, and most importantly, what you should actually do about it.
The Mathematics of Overvaluation
Four Metrics at Record Highs
Bank of America's equity strategy team, led by Savita Subramanian, tracks 20 distinct valuation metrics for the S&P 500. Here's what should make you sit up: all 20 metrics currently show the market trading above historical averages. That's never happened outside major market peaks.
More concerning, four critical measures have reached all-time record highs, exceeding even the dot-com bubble peak of March 2000:
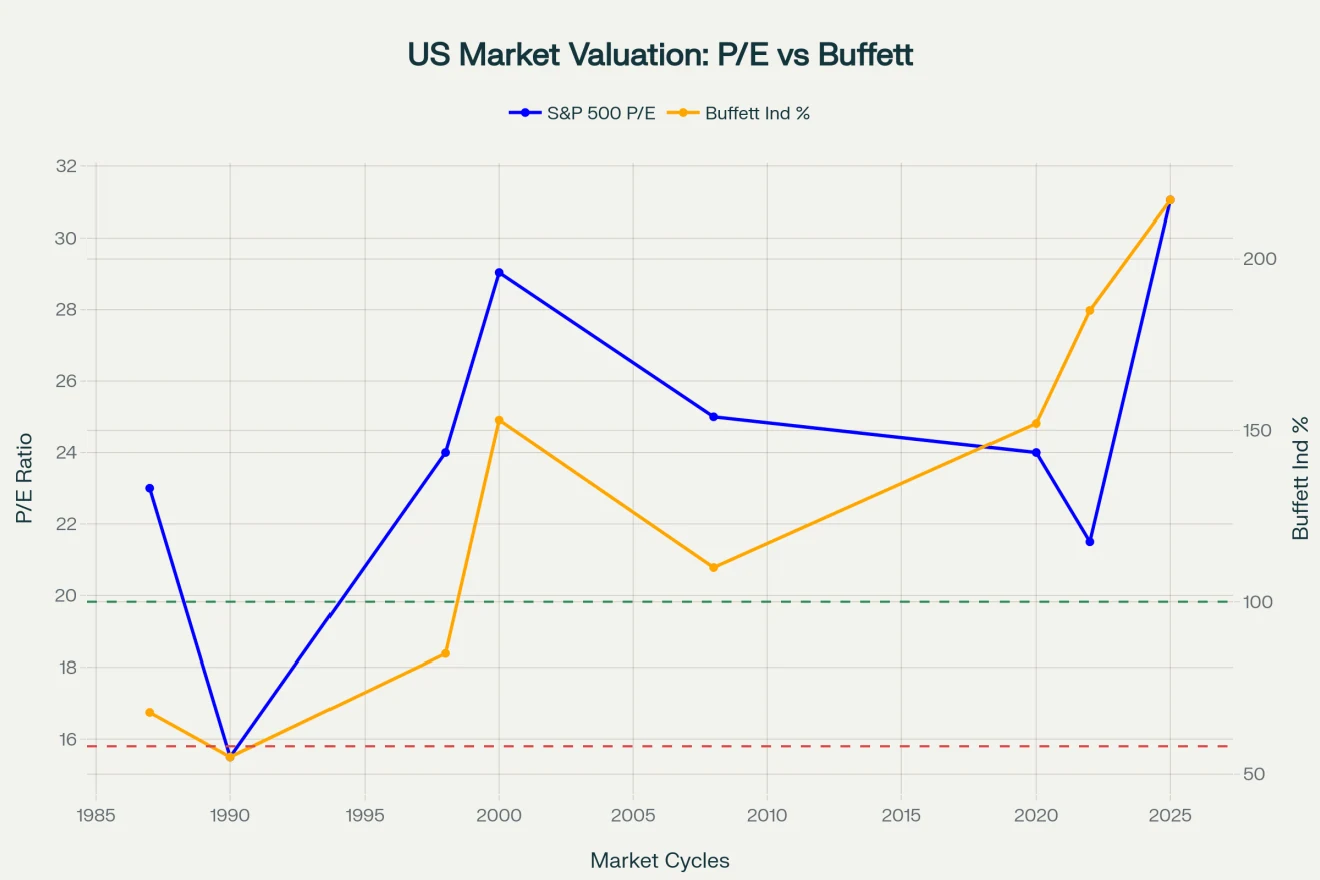
1. The Buffett Indicator: 217%
Warren Buffett once called the market cap-to-GDP ratio "probably the best single measure" of broad market valuation. Think about what this number means: the total value of all US publicly traded stocks equals 217% of the entire US economy's output. That's like saying a company worth $2.17 is generating only $1 in annual revenue—permanently.
The historical average sits around 100%. The dot-com bubble peaked at 153%. The 2008 pre-crisis high was 110%. Today's reading of 217% sits approximately 2.2 standard deviations above the historical trend. Buffett himself warned that readings above 200% mean investors are "playing with fire."
The implication is mathematical: the stock market has grown dramatically faster than the underlying economy supporting it. That's an unsustainable trajectory that eventually reverts to the mean—and mean reversion is rarely gentle.
2. Price-to-Book Ratio: 5.3x
The S&P 500's price-to-book ratio has surged to 5.3x, surpassing the 5.1x recorded at the absolute peak of the dot-com bubble. This metric measures total market capitalization against total net assets (assets minus liabilities).
When investors pay $5.30 for every dollar of net assets, they're betting on either extraordinary future growth or that book values dramatically understate real asset worth. BofA strategist Michael Hartnett highlighted this with the ominous warning: "It better be different this time."
3. Price-to-Operating Cash Flow: Record Territory
Operating cash flow represents the actual cash companies generate from business operations-arguably the most reliable measure of financial health. When the entire S&P 500's price relative to aggregate operating cash flow hits record levels, investors are paying unprecedented premiums for current cash generation.
4. Enterprise Value-to-Sales: All-Time Highs
Enterprise value (market cap plus debt minus cash) relative to sales has breached all-time highs. This metric strips out profitability entirely and asks a simple question: how much are investors paying per dollar of revenue? At record levels, the market is pricing in either massive margin expansion or explosive revenue growth that may not materialize.
Nine Metrics Above Dot-Com Levels
US market valuation trends from 1987 to 2025, showing both P/E ratios and the Buffett Indicator (Market Cap/GDP) reaching extreme levels in October 2025.
Beyond the four record-breakers, an additional five metrics have surpassed their March 2000 dot-com bubble peaks. In total, nine of the 20 metrics tracked by Bank of America
now trade above Tech Bubble levels.
This comparison matters because the dot-com crash that followed saw the Nasdaq plunge 78% peak-to-trough, while the S&P 500 fell 49%. It took the Nasdaq 15 years to reclaim its 2000 highs. Investors who bought at the peak in early 2000 didn't break even until 2015—a lost decade and a half.
The Shiller CAPE ratio (cyclically adjusted P/E using 10-year average inflation-adjusted earnings) has surpassed 40 for the first time since the dot-com bubble. This level has only been exceeded three times in history: 1929, 2000, and 2021. All three instances preceded major market declines.
Bank of America's Bear Market Signposts: 60% Triggered
BofA's bear market signposts represent a comprehensive early warning system developed through analysis of every major market peak since 1990. These ten indicators span valuation, macroeconomic conditions, and market sentiment. Currently, six of the ten are activated:
Valuation Signposts (Triggered)
The 10-year Z-score of trailing S&P 500 P/E plus year-over-year CPI exceeds 1 standard deviation, combining valuation excess with inflation pressure
Low P/E stocks are underperforming high P/E stocks by more than 2.5 percentage points over the last six months—classic late-stage speculation where "quality be damned, just buy growth"
Macro Signposts (Triggered)
The yield curve has been inverted since July 2022, one of the longest inversions in history. When short-term rates exceed long-term rates, it traditionally signals investor concerns about future economic growth
The Federal Reserve's Senior Loan Officer Opinion Survey (SLOOS) shows 16% of banks have tightened commercial lending standards to large firms. Banks tighten credit when they perceive rising risk, often just before trouble materializes
The Credit Stress Wild Card
Notably, BofA's Credit Stress Indicator hasn't triggered yet, sitting at 0.39 versus the critical 0.25 threshold. This measures credit conditions using volatility, credit access, leverage, and ratings. It typically drops below 0.25 within six months of a market peak.
However, recent developments in the $1.7 trillion private credit market may render this metric a lagging indicator this cycle—which brings us to the most insidious systemic risk.
The Private Credit Time Bomb
How Forced Selling Could Trigger Cascading Liquidations
Bank of America has identified a structural vulnerability in modern portfolio construction that could trigger cascading liquidations in equity markets. Many large institutional investors—pension funds, endowments, and sovereign wealth funds—have adopted a "barbell strategy" over the past decade:
One End: Highly liquid, low-cost passive investments like S&P 500 index funds
Other End: Complex, high-return illiquid private equity and private credit funds This strategy worked brilliantly in a low-rate, rising-market environment. But it creates a catastrophic liquidity mismatch during stress.
The private credit market has faced escalating scrutiny amid higher interest rates, with recent high-profile bankruptcies (Tricolor Holdings, First Brands Group) reigniting fears about underwriting standards. The Bank of England governor stated these collapses are "ringing alarm bells." The IMF warned in October 2025 that "nonbank lenders, especially private credit funds, have grown rapidly, adding to financial stability risks because they are less regulated and their increasing interconnectedness with banks could exacerbate adverse shocks."
Here's the dangerous chain reaction: if private credit investments sour, institutional investors cannot quickly liquidate them. These assets are "private"—there's no daily public market, no exit. Investors face losses or marking requirements but cannot raise cash from the troubled holdings.
Savita Subramanian explains: "If private lending hiccups continue, pensions may be forced sellers of index funds to avoid punitive private asset marks and meet ongoing obligations."
They must sell what's liquid. For most institutions, the largest and easiest asset to sell is their S&P 500 index fund position. When pension funds liquidate index funds, those funds must in turn sell the underlying stocks proportionally across all 500 constituents. This creates indiscriminate selling pressure—high-quality companies get sold alongside
garbage not because of fundamentals, but because of an exogenous liquidity crisis.
BofA strategists warn this could trigger "another broad equities rout" as institutional investors are "compelled to sell."
Historical Pattern Recognition
Historical market drawdowns from 1987 to 2022, showing the severity of peak-to-trough declines across major market cycles.
The chart above shows the magnitude of major market corrections since 1987. The pattern is clear: when valuations reach extreme levels, corrections follow. The depth varies—from "standard" 20% bear markets to devastating 50%+ crashes—but the cycle repeats.
Key Historical Lessons:
Deepest Drawdown: The 2008 Global Financial Crisis stands as the most severe at -55.7%, taking 17 months to reach bottom and 49 months to recover to previous highs. Investors who bought at the October 2007 peak didn't break even until March 2013—over five years of waiting.
Fastest Collapse: COVID-19 took only one month to hit bottom with a -35% decline—unprecedented speed driven by forced lockdowns and economic uncertainty.
Longest Decline: The dot-com bubble deflated over 24 months, creating a grinding bear market where hope alternated with despair. The eventual recovery took 33 months—nearly three years.
Average Pattern: Historical analysis shows average drawdowns of -32% take approximately 7.4 months to bottom and 11 months to recover. But averages mask wide variance—some recoveries happen in months (2020), others take years (2000-2003, 2008-2013).
The crucial insight: recovery time matters more than drawdown magnitude for most investors. A 50% decline that recovers in 12 months causes less pain than a 30% decline that takes five years to recover.
India's Transmission Channels: How Global Stress Hits Home
The Sobering Reality
India has been labeled the world's worst-performing major market in 2025, delivering merely 1.9% returns while Korea and Germany surged. This relative underperformance reflects both global recession fears and India-specific challenges. Let's understand exactly how US market stress transmits to Indian portfolios.
Export Dependency: The Direct Hit
The United States accounts for 18.1% of India's merchandise exports ($71.5 billion in FY22). Goldman Sachs modeling suggests a 1.2% US economic contraction could reduce India's GDP growth by 1.5 to 2.5 percentage points, potentially moderating from 7.5% to around 6%.
Export-dependent sectors face direct revenue pressure: IT services, pharmaceuticals, automotive components, textiles, and precision engineering all derive substantial revenue from US clients. When American companies cut technology budgets or delay capital expenditures during recessions, Indian IT firms see contract renewals postponed and deal pipelines dry up.
Foreign Portfolio Outflows: The Liquidity Drain
During risk-off periods, global capital flows to "safe" US Treasuries and German bunds. Foreign Portfolio Investors have already withdrawn billions from Indian equities in 2025 amid recession fears. These outflows trigger:
Rupee depreciation as dollar demand increases
Import inflation as crude oil, electronics, and machinery become more expensive in rupee terms
Valuation compression as forced selling pushes stock prices down regardless of fundamentals
Credit tightening as banks become more conservative The January-February 2025 preview demonstrated this dynamic: ₹64,000 crore in FPI outflows triggered a 9% Nifty correction in just weeks.
The Tariff Headwind
India's investment case has deteriorated further due to US trade policy. President Trump recently doubled tariffs on India to a steep 50% in response to India's purchases of Russian oil. This represents a dramatic shift. As wealth management analyst Ariana Chiu notes: "One reason investors had favored India was that, unlike China, it was not thought to be in the crosshairs of US protectionism."
Higher tariffs make Indian exports less competitive in the US market, directly hitting export-oriented companies' margins and volumes.
The Manufacturing Mirage
Despite hopes that India would emerge as a supply chain alternative to China during deglobalization, India's share of global manufacturing has barely budged over the past 15 years. This structural failure limits India's ability to offset export weakness through market share gains.
India Sector Risk Analysis: Who Gets Hit, Who Holds
High-Risk Sectors (Risk Score: 7-9)
IT Services (Risk Score: 8)
Exposure:60% of revenue from US/EU exports
Risk Trigger: US tech spending cuts, AI-driven cost optimization fatigue, visa restrictions
Likely Impact: EPS down 10-15% if US recession materializes
Why It Matters: IT services represent one of India's largest export sectors. American companies slash discretionary technology spending first during downturns. The recent Infosys rally on buyback news may prove short-lived if client budgets contract.
Risk Trigger: Oil price spikes above $80/barrel plus rupee depreciation
Likely Impact: Severe margin compression or losses
Key Stocks: IndiGo, SpiceJet, Adani Ports
Why It Matters: IndiGo already reported Q1 FY25 net losses due to high fuel costs. Further crude price increases or rupee weakness could force capacity cuts and route cancellations.
Oil & Gas / Petrochemicals (Risk Score: 8)
Exposure: Crude and LNG imports for refining and petrochemical feedstock
Risk Trigger: Brent crude rising above $80/barrel
Likely Impact: Margin squeeze for oil marketing companies; mixed for integrated players like Reliance
Why It Matters: OMCs (oil marketing companies) face "under-recovery" when they cannot pass through crude price increases to consumers due to government price controls. BPCL and IOC carry 90% cost linkage to crude.
Chemicals (Risk Score: 7)
Exposure: Petrochemical feedstock imports
Risk Trigger: Crude-linked input cost inflation
Likely Impact: Cost pressure, margin compression unless pricing power exists
Why It Matters: Specialty chemicals and paints derive 38-55% of costs from crude-linked inputs. Asian Paints suffered a 220 basis point margin hit in FY22 when crude spiked. Current crude at $64/barrel provides relief, but geopolitical risks remain.
Moderate-Risk Sectors (Risk Score: 5-6)
Pharma (Risk Score: 5)
Exposure:35% of revenue from US generics market
Risk Trigger: Generic price erosion, FDA inspection delays or warnings
Likely Impact: Mild to moderate pressure
Key Stocks: Sun Pharma, Dr. Reddy's, Cipla, Lupin, Torrent Pharma
Why It Matters: Pharmaceuticals offer relative resilience—healthcare demand is non-discretionary. However, US generic pricing pressure continues, and FDA regulatory hurdles can delay new product launches.
Auto & Tyres (Risk Score: 6)
Exposure: Steel, aluminum, and rubber costs; semiconductor chip availability
Risk Trigger: Commodity cost inflation and supply chain disruptions
Why It Matters: Auto sector faces headwinds from higher input costs but benefits from strong domestic demand. Electric vehicle transition creates both disruption and opportunity.
Banks & NBFCs (Risk Score: 6)
Exposure: Credit cycle sensitivity
Risk Trigger: Slower loan growth, NIM compression, asset quality deterioration
Likely Impact: Moderate—well-capitalized banks with retail focus fare better
Key Stocks: HDFC Bank, ICICI Bank, Kotak Mahindra Bank, Bajaj Finance, SBI
Why It Matters: Economic slowdowns typically lag equity market corrections by 6-12 months. Banks with strong deposit franchises and conservative underwriting standards weather storms better than aggressive lenders.
Why It Matters: People don't stop buying toothpaste, soap, biscuits, and tea during recessions. FMCG companies offer defensive positioning with dividend yields typically in the 2-4% range.
Utilities & Infrastructure (Risk Score: 2)
Exposure: Government-led capital expenditure
Risk Trigger: Budget allocation continuity
Likely Impact: Resilient—essential services with regulated returns
Key Stocks: NTPC, Power Grid Corporation, Indian Railway Finance Corporation (IRFC)
Why It Matters: Utility demand is stable regardless of economic cycles. Electricity consumption continues. Government infrastructure push remains policy priority across political parties.
Company-Level Crude Exposure: The Hidden Vulnerability
The following companies carry significant cost exposure to crude oil prices. While Brent currently trades at $64.76/barrel (down 13% year-over-year), geopolitical tensions could reverse this quickly:
Company
Exposure Type
% Cost Linked to Crude
Sensitivity
IOC, BPCL, HPCL
Direct crude import for refining
90%
Very High
IndiGo
Aviation turbine fuel
40%
Very High
Deepak Nitrite
Petrochemical feedstock
55%
High
Asian Paints
Raw materials (TiO2, solvents)
45%
High
Berger Paints
Solvent chemicals
40%
High
Pidilite
Petro-based resins
38%
High
Reliance Industries
Refining spread
35%
Medium
Adani Ports
Logistics/fuel costs
25%
Medium
Investment Implication: Companies with 40%+ crude linkage face material earnings volatility. A $20/barrel increase in Brent from current levels ($64 to $84) could compress EBITDA margins by 200-400 basis points for paint and chemical companies, and push airlines back into losses.
Commodities: The Safe-Haven Divergence
The commodity markets are telling two very different stories, and both matter for Indian investors.
Gold: The $4,100 Insurance Policy
Gold trades at $4,100 per troy ounce, up nearly 50% year-over-year. In India, prices recently touched ₹125,890 per 10 grams despite profit-booking. Gold remains one of 2025's best-performing assets with a 56% gain since January.
The metal thrives on exactly the conditions present today: geopolitical tension, growth concerns, monetary uncertainty, and negative real interest rates in many markets. As currency debasement accelerates globally through fiscal deficits and quantitative easing, gold reasserts its 5,000-year role as the ultimate store of value.
Indian Investor Access:
Sovereign Gold Bonds (tax-efficient, offering 2.5% annual interest)
Silver has delivered an exceptional 70% rally in 2025, currently trading at $49 per ounce. The metal benefits from dual demand: safe-haven flows like gold, plus industrial demand from solar panels, electric vehicles, and electronics manufacturing. Analysts project silver could reach $56.51 within 12 months.
Silver's supply-demand fundamentals look stronger than gold's, with industrial applications consuming roughly 50% of annual mine production. The global energy transition and electronics boom create structural demand growth.
Brent Crude: The Demand Destruction Story
In stark contrast, Brent crude has declined to $64.76 per barrel, down 13% year-over-year. The US Energy Information Administration forecasts Brent will fall further to $62/barrel in Q4 2025 and $52/barrel in 2026.
Rising US-China trade tensions, OPEC+ oversupply, weakening global demand, and energy transition away from fossil fuels all signal continued pressure. Low oil prices historically correlate with weak economic growth—another recession indicator.
The Divergence Message: Precious metals surge while industrial commodities slump. This is classic late-cycle behavior when investors prioritize safety over growth.
The Bull Case: Why Crash Predictions May Be Wrong
Intellectual honesty requires presenting the counter-arguments. Despite ominous signals, several powerful forces support continued market strength.
Record Corporate Buybacks: $1.1 Trillion in 2025
American corporations are repurchasing shares at the fastest pace in history. By August 2025, buyback announcements hit $1 trillion—the fastest to reach that milestone since tracking began in 1982. At current rates, 2025 will see $1.1 trillion in repurchases, an all-time record.
Companies initiate buybacks when management believes shares are undervalued relative to intrinsic worth. Major players including Apple ($800 billion since 2012), Meta ($17.6 billion in Q1 alone), and JP Morgan continue aggressive programs. This represents real demand—corporations using actual cash flow to reduce share count, mathematically increasing earnings per share even if absolute earnings remain flat.
Structural Justification for Higher Multiples
Savita Subramanian herself acknowledges that despite extreme valuations, there may be legitimate structural reasons the market deserves to trade at a premium to history:
Compositional Changes: Asset-heavy manufacturing constituted nearly 70% of the S&P 500 in 1980; today it's less than 20%. The index has transformed into a collection of asset-light, high-margin, technology-enabled businesses with superior economics.
US Premium Justified: The US market's premium over international markets is "likely warranted" because US companies deliver roughly double the long-term growth potential of Asia and Europe, with less earnings volatility and higher free cash flow per share.
The "Weak but Stable" Economic Reality
UBS acknowledges that while their recession probability reads 93%, the economy shows "weak but stable" conditions rather than collapse. None of the major data series show sharp deviations from trend—suggesting stagnation risk rather than imminent crash.
This paradox matters: markets can grind higher in weak-but-stable environments as long as the discount rate (interest rates) remains accommodative and corporate profitability holds. The 2010-2019 expansion demonstrated exactly this dynamic—perpetual worries about "the next recession" while markets climbed a wall of worry.
Earnings Growth vs. Nominal Inflation
Morgan Stanley's Mike Wilson argues we've entered a new inflationary regime requiring shorter, hotter cycles. In this framework, higher inflation means higher nominal earnings growth, which can justify elevated P/E multiples.
His model suggests two-year up cycles followed by one-year corrections. We're currently in an up cycle that began April 2025—suggesting potential continuation into 2026 before a meaningful correction.
Strategic Recommendations: Your Action Plan
Given the paradox of extreme valuations versus strong corporate fundamentals, what should you actually do? Here's a practical framework.
1Embrace Defensive Positioning (Don't Panic, Just Prepare)
History demonstrates that defensively-tilted portfolios declined 30-40% less than the S&P 500 during 2022-2023 volatility while maintaining income. Focus on sectors with stable revenues regardless of economic conditions:
Utilities and Consumer Staples: HUL, ITC, Nestle India, Britannia offer recession resistance
Healthcare and Pharmaceuticals: Sun Pharma, Dr. Reddy's, Cipla provide non-discretionary medical demand
Dividend Aristocrats: Companies with 20+ years of uninterrupted dividend growth demonstrate earnings resilience through multiple cycles
2Diversify Aggressively Across Asset Classes
Target Allocation for Conservative Investors:
Equities: 40-50% (shift composition toward quality and defensives)
Debt: 25-35% (government securities and AA+ corporate bonds)
Gold & Silver: 10-15% (portfolio hedge, Sovereign Gold Bonds preferred)
SIPs excel during uncertain times by removing emotion and timing pressure. For cash-rich investors, park funds in liquid or debt mutual funds and use Systematic Transfer Plans (STPs) to gradually shift to equity over 6-12 months.
This rupee-cost averaging reduces the risk of deploying everything at market peaks while ensuring participation if markets continue higher. Think of it as dollar-cost averaging applied to portfolio rebalancing.
4Sector Rotation Toward Resilience
Within your equity allocation, rotate from high-beta cyclicals toward:
FMCG and Consumer Staples (Dabur, Godrej Consumer, Marico)
Pharmaceuticals with diversified geographic exposure
Well-capitalized banks with retail deposit focus (HDFC Bank, Kotak Mahindra)
Utilities and Infrastructure (NTPC, Power Grid, Indian Railway companies)
5Maintain Strategic Cash Reserves (15-20%)
Keep 10-20% of your portfolio in cash or cash-equivalents (liquid funds, money market funds, short-term FDs). This serves dual purposes:
Downside Protection: Cash doesn't decline in value (though it loses purchasing power to inflation)
Opportunity Ammunition: Market dislocations create opportunities to buy quality assets at distressed valuations As Warren Buffett famously stated: "Be fearful when others are greedy, and greedy when others are fearful." Cash enables you to be greedy when fear peaks.
Low Debt-to-Equity Ratios (below 0.5 for non-financials; below 5x for banks)
Consistent Return on Equity (above 15% sustained over 5+ years)
Economic Moats (pricing power, network effects, brand strength, regulatory barriers) These businesses weather storms and emerge stronger when weaker competitors fail.
7Avoid These Common Mistakes
Don't: Attempt to time the exact market peak (impossible to do consistently) Don't: Use leverage or margin in stretched markets Don't: Chase momentum stocks without earnings support Don't: Panic sell quality positions during volatility Don't: Ignore valuation discipline because "this time is different"
Do: Gradually reduce risk rather than making binary all-in or all-out bets Do: Rebalance systematically when allocations drift Do: Focus on cash flow generators over capital appreciation stories Do: Maintain investment discipline through volatility
8The Oorjita Signal Checklist
Monitor these indicators monthly to assess risk levels:
Indicator
Risk Threshold
Current Status
Signal
S&P 500 CAPE
> 40
40.5
Red
Nifty 50 P/E
> 22x
21.8x
Amber
Brent Crude
> $80
$64.76
Green
INR/USD
> ₹90
₹87.88
Amber
India VIX
> 18
16.2
Green
NSE Breadth (% above 200DMA)
< 45%
42%
Red
FPI Net Flows
< -₹10,000 cr/month
-₹18,500 cr
Red
US Yield Curve
Inverted
Inverted
Red
Current Risk Assessment: 4 Red signals, 2 Amber, 2 Green = Elevated Risk Environment
The Three Scenarios: What Could Happen Next
Scenario 1: Soft Landing (30% Probability)
US economy slows but avoids recession. Corporate earnings moderate but remain positive. Markets correct 10-15% then stabilize. India's domestic consumption offsets export weakness. Nifty ends 2026 at 26,500-27,500.
What You Should Do: Maintain current allocations but tilt toward quality. Use any 10-12% corrections to add to core positions. Stay patient.
Scenario 2: Muddle Through (40% Probability)
Elevated volatility with no clear direction. Valuations compress via time (earnings grow into multiples) rather than price declines. Range-bound markets for 12-18 months. India oscillates between 24,000-27,000. Stock-picking and sector rotation become critical.
What You Should Do: Active management adds value in sideways markets. Focus on dividend yield (4-6%), rotate between defensives and cyclicals based on momentum. SIPs continue working well.
Scenario 3: Bear Market (30% Probability)
US recession materializes. Corporate earnings decline 15-20%. S&P 500 falls 25-35% from peak. India declines 20-30% due to FPI exodus and export collapse. Nifty tests 20,000-22,000. Creates generational buying opportunity for quality companies.
What You Should Do: Don't panic, but do hedge. Gold allocation protects portfolio. Cash reserves deployed systematically into quality names at depressed valuations. This is when fortunes are made—by those who have dry powder and emotional discipline.
The Balanced Perspective: Living with Uncertainty
The data presents a genuine paradox that requires intellectual honesty. Recession probabilities at 93%, valuation metrics at historic extremes, and 60% of bear market signposts flashing all suggest caution is warranted. The mathematical reality of overvaluation—particularly the Buffett Indicator at 217%, price-to-book ratios exceeding the dot-com peak, and all 20 BofA metrics in expensive territory—cannot be dismissed.
Yet record corporate buybacks ($1.1 trillion in 2025), solid earnings fundamentals, structural improvements in the S&P 500's composition, and the absence of sharp economic deterioration suggest markets could continue grinding higher.
The truth likely lies between extremes: expect elevated volatility, periodic sharp corrections of 10-15%, and significant sector rotation rather than a single catastrophic crash. The 2025 market resembles 1999 more than 2008-a valuation bubble driven by transformative technology (AI now, internet then) that could deflate gradually or burst suddenly depending on catalysts we cannot predict.
India's Dual Challenge
For Indian investors, the challenge is twofold:
Navigating global recession risk that could trigger 15-25% corrections via export pressure, FPI outflows, and credit tightening
Overcoming India-specific headwinds including elevated tariffs, manufacturing shortfalls, and relative underperformance The silver lining: India's domestic consumption story remains intact. A 7-8 trillion dollar economy growing at 6-7% annually provides opportunity for stock-pickers focused on domestic champions. Companies serving India's rising middle class—consumer goods, financial services, healthcare, education, real estate—face long-term structural tailwinds regardless of short-term global turbulence.
Final Thoughts: The Cardinal Rule
Don't attempt to time the exact peak. It's a fool's errand that even professional investors fail at consistently. Instead, systematically reduce risk, increase quality, and build resilience into your portfolio.
Those who survive volatility intact can capitalize on the generational buying opportunities that follow market dislocations. The 2008 crisis created millionaires among those who had cash and courage to buy when blood was in the streets. The March 2020 COVID crash offered similar opportunities—but only for investors who hadn't panicked and still had ammunition.
As Bank of America's Savita Subramanian counsels: "Be selective." Exit index funds in favor of individual stock selection. Withdraw from speculative momentum and rotate to cash-generative quality. Reduce leverage and increase dry powder.
The market may continue higher for months-missing some upside is acceptable if it means avoiding catastrophic downside. As the old Wall Street adage warns: "Bulls make money,
bears make money, but pigs get slaughtered."
Your goal isn't to be the smartest investor in the room. Your goal is to still be in the room when the next cycle begins.
Disclaimer: This analysis is for informational and educational purposes only and should not be considered investment advice. Oorjita FinAI Services is not a registered investment advisor. All investment decisions should be made in consultation with qualified financial advisors. Market conditions can change rapidly, and all projections are subject to significant uncertainty. Past performance does not guarantee future results.