Sudeep Pharma: 39.7% EBITDA Margins and Capacity Doubling After Its IPO
Sudeep Pharma Limited is a technology-led specialty ingredients manufacturer serving the pharmaceutical, food, and nutrition industries. Founded in 1989 with 35+ years of expertise in mineral chemistries, the company recently listed on NSE/BSE on November 28, 2025.
MK
Dr. Murali KalyanaramanGlobal CFO · 30+ years in corporate finance · Chartered Accountant (ICAI) · 41 min read
This research is for information and education only and is not investment advice. Figures may be provisional. Oorjita.AI and its authors may hold positions in securities mentioned. Please consult a SEBI-registered investment adviser before making investment decisions. Published Thursday, 12 February 2026, 8:13 PM IST.
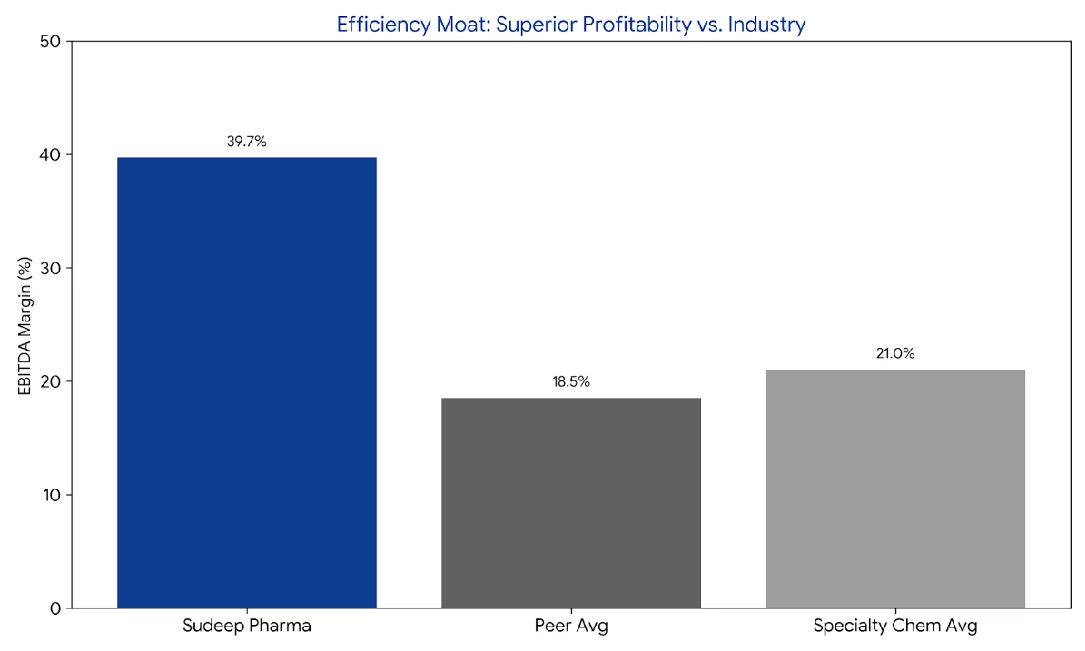
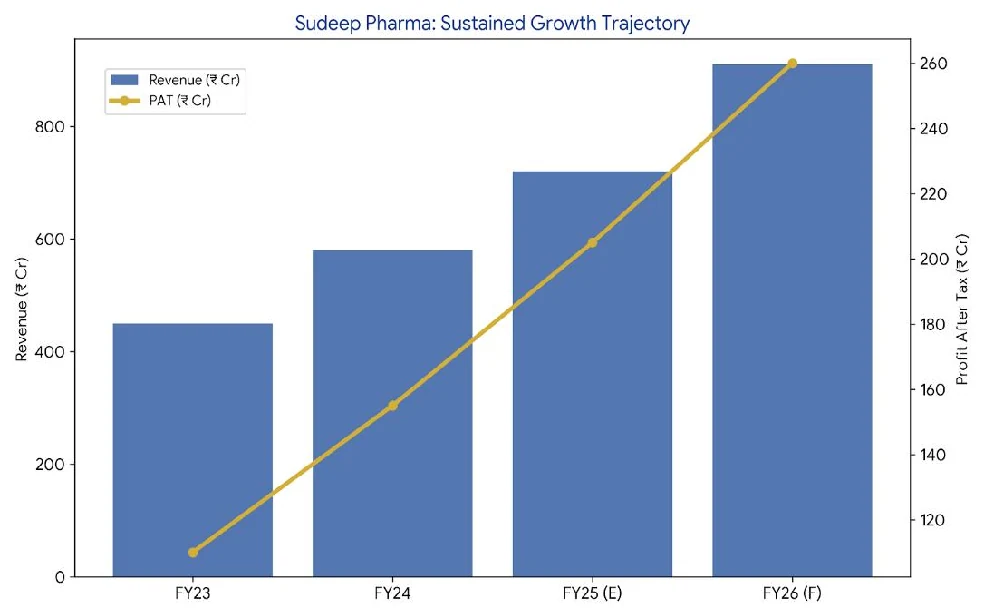
Sudeep Pharma Limited is a technology-led specialty ingredients manufacturer serving the pharmaceutical, food, and nutrition industries. Founded in 1989 with 35+ years of expertise in mineral chemistries, the company recently listed on NSE/BSE on November 28, 2025. With industry-leading profitability metrics (39.7% EBITDA margin, 27.6% PAT margin), six proprietary technologies, and a blue-chip global customer base, Sudeep Pharma is positioned for 20-25% revenue CAGR driven by capacity expansion, acquisitions, and entry into battery materials.
Investment Highlights:
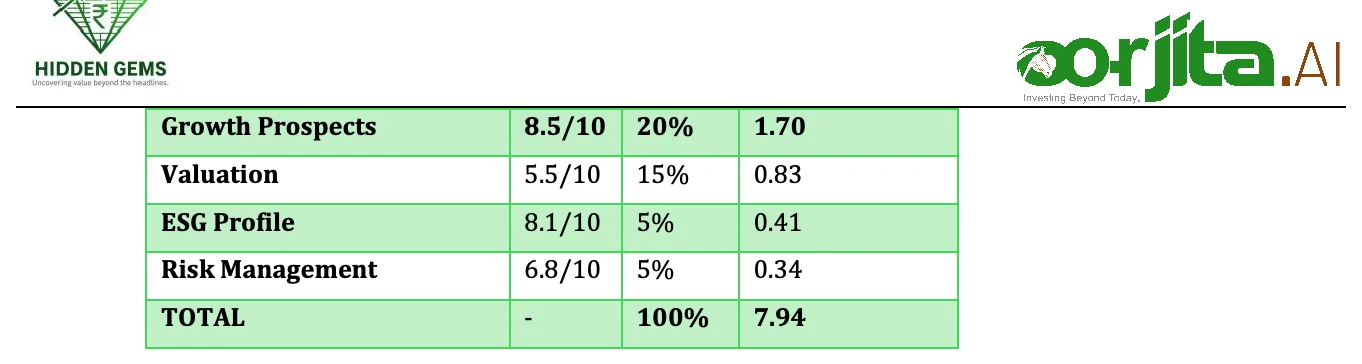
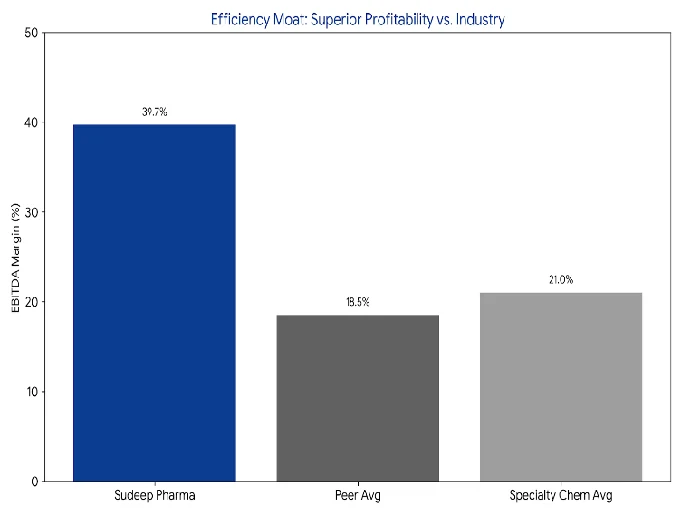
Best-in-class margins outperforming peers by 15-20 percentage points
83.6% repeat business, 7+ year avg relationships, embedded
Very High
9/10
Relationships
in customer R&D cycles
Manufacturing Expertise
35 years of specialized mineral chemistry know-how; particle engineering capabilities
High
8/10
Global Distribution
Warehouses in USA, Europe, Africa, Asia; 15 global
Moderate-
7/10
warehouses enable just-in-time delivery
High
Intellectual Property
Proprietary formulations, process patents; limited patent portfolio vs. technology know-how
Moderate
6/10
Overall Moat Rating: 8.1/10 (STRONG)
Moat Sustainability: The combination of regulatory approvals, switching costs, and long-term customer relationships creates a self-reinforcing competitive advantage. New entrants face 10-15 year timelines and ₹200-300 Cr capital requirements to replicate Sudeep's market position.
4Recent Quarterly Performance (Q3 & 9M FY26)
Q3 FY26 Standalone Results
Metric
Q3 FY26
Q2 FY26
Q3 FY25
QoQ Change
YoY Change
Revenue (₹ Cr)
90.28
87.88
83.48
+2.7%
+8.1%
EBITDA (₹ Cr)
36.62
39.90
25.97
-8.2%
+41.0%
EBITDA Margin %
40.6%
45.4%
31.1%
-480 bps
+946 bps
PAT (₹ Cr)
26.87
29.74
20.63
-9.7%
+30.2%
PAT Margin %
29.8%
33.8%
24.7%
-406 bps
+505 bps
EPS (₹)
2.42
2.67
1.90
-9.4%
+27.4%
9M FY26 Consolidated Performance
Metric 9M FY26 9M FY25 YoY Change
Key Trends & Observations
Positives:
Strong YoY Revenue Growth: 8.1% standalone, 33.5% consolidated (NSS consolidation from May 2025)
PAT Growth Outpacing Revenue: 30.2% PAT growth on 8.1% revenue growth indicates operating leverage
Margin Expansion YoY: EBITDA margin up 946 bps vs Q3 FY25, reflecting product mix shift to specialty ingredients
Export Momentum: Export share increased to 39% in H1FY26 from 32% in H1FY25 Concerns:
Sequential Margin Compression: Q3 EBITDA margin 40.6% vs Q2 45.4% due to NSS integration costs and new warehouse setup
Working Capital Spike: WC days at 195 (vs 184 in FY25) due to NSS inventory consolidation and USA/Europe warehouse stocking
Return Ratios Compressed: ROCE at 24.5% (vs 30% FY25) reflecting ongoing capex investments
Management Commentary:
"The NSS business is integrating smoothly with early synergies visible. Working capital elevation is temporary, driven by warehouse inventory buildup expected to normalize over the next 6 months as turns improve."
5Annual Performance (fy23-Fy25)
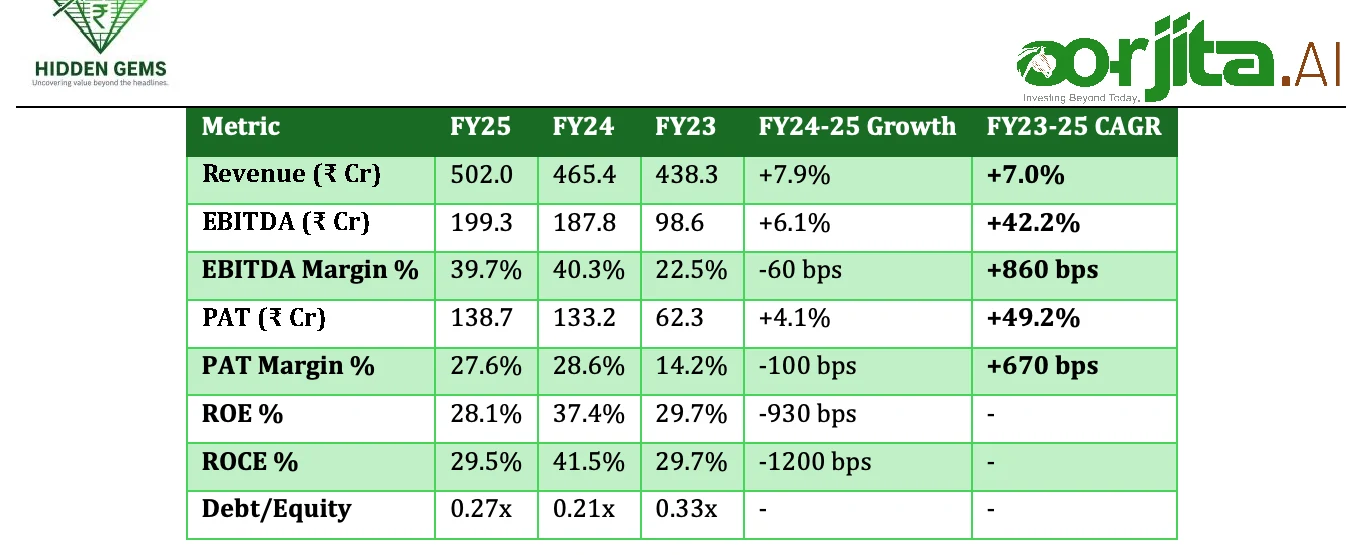
Consolidated Financial Performance
Key Ratio Analysis
Liquidity Ratios
FY25
FY24
Industry Avg
Current Ratio
2.43x
2.01x
1.5-2.0x
Quick Ratio
1.69x
1.52x
1.0-1.5x
Leverage Ratios
FY25
FY24
Industry Avg
---
---
---
---
Debt-to-Equity
0.27x
0.21x
0.3-0.5x
Interest Coverage
31.4x
44.9x
10-20x
Efficiency Ratios
FY25
FY24
Industry Avg
---
---
---
---
Asset Turnover
0.70x
0.91x
0.8-1.2x
Inventory Days
94
53
60-90
Receivables Days
135
114
90-120
Financial Health Assessment: STRONG
Excellent liquidity with current ratio > 2.4x
Conservative leverage at 0.27x debt/equity (post-IPO improved to 0.10x)
Strong interest coverage of 31x indicates low financial risk
Working capital spike temporary; asset turns to improve with capacity utilization
Metric
Score
Oorjita Analyst Commentary
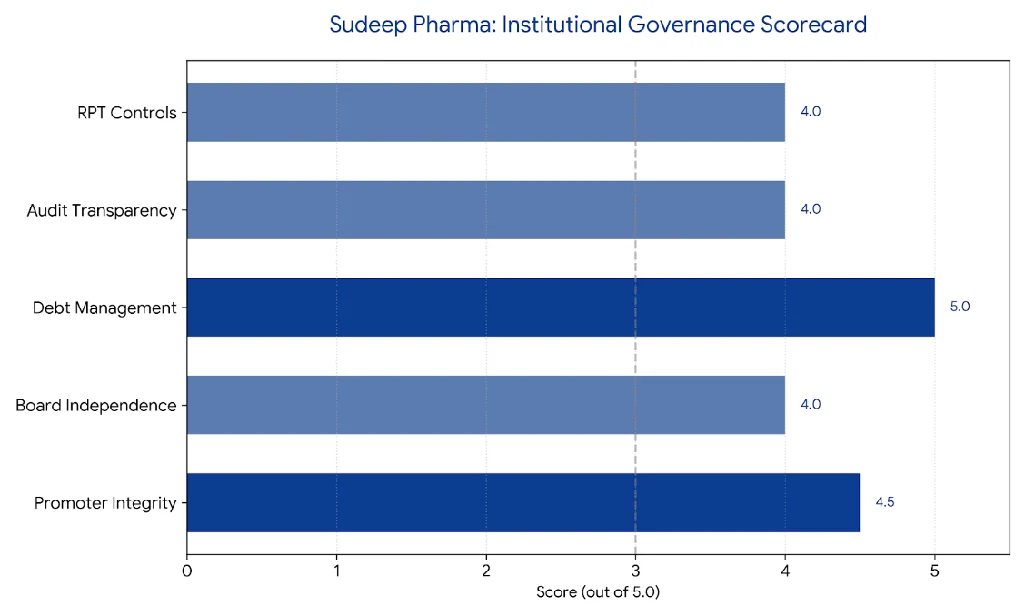
Promoter Integrity
4.5/5
35-year unblemished track record; high post-IPO "skin in the game."
Board Independence
4.0/5
Strong mix of industry veterans and independent oversight.
Debt Management
5.0/5
Exceptional Net Debt/Equity of 0.10x; prudent capital allocation.
Only scalable producer outside China; FEOC-compliant supply chain
Market Opportunity: LFP battery market growing at 52% CAGR from USD 14.4 Bn (2024) to USD 115.2 Bn (2030). China controls 100% of precursor supply – geopolitical diversification favors India-based suppliers.
Investment Insight: This segment transitions Sudeep from a Pharma Proxy to a Climate-Tech Proxy. Success in this niche could justify a "Specialty Chemical Premium" P/E multiple of 60x–70x, similar to high-end battery material peers globally.
Deep Dive: The LFP Battery Materials Pivot
Title: The "Iron" in the Energy Revolution: Sudeep’s LFP Precursor Play
While Sudeep Pharma is currently valued as a specialty chemical/pharma company, its entry into high-purity Iron Phosphate for Lithium Iron Phosphate (LFP) batteries creates a "valuation re-rating" catalyst. The Technical Edge: LFP batteries are the global preference for mass-market EVs and Energy Storage Systems (ESS) due to their safety and lower cost compared to Nickel-Cobalt (NMC) chemistries. The bottleneck in LFP performance is purity. Sudeep’s 35 years of mineral chemistry expertise allows them to produce iron phosphate with "six-sigma" purity levels, critical for extending battery cycle life. The Import Substitution Angle: Currently, India imports over 90% of its LFP precursor materials from China. Sudeep is positioned as a primary domestic source for Tier-1 cell manufacturers (like Exide Energy, Amara Raja, or Reliance), aligning perfectly with the government's PLI schemes.
Execution Track Record: "Say to Do" Ratio
Commitment
Status
Rating
IPO Completion (Nov 2025)
Delivered on time
A
NSS Integration (2025)
Ahead of schedule (synergies visible in H1FY26)
A+
FY25 Revenue Guidance (₹500 Cr)
Achieved ₹502 Cr
A
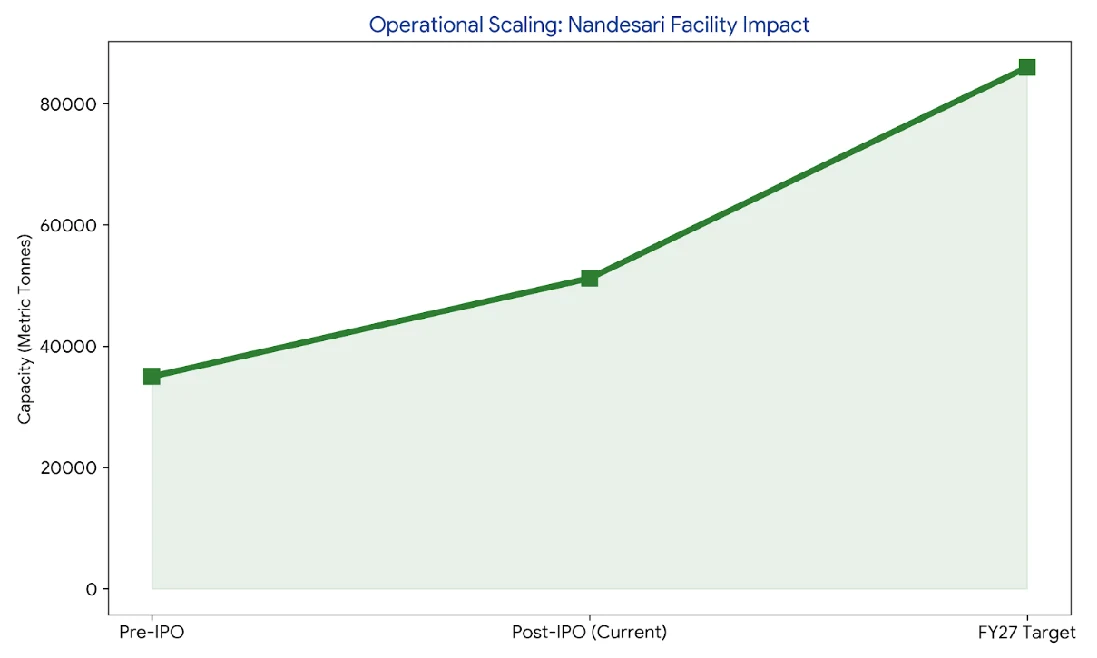
Nandesari Commissioning (Q4 FY26)
On track (85% complete)
A-
Battery Materials Customer Validation
36 customers engaged
A
Overall Execution Rating: A (Excellent)
Management has demonstrated strong execution discipline with IPO proceeds deployed efficiently (₹1.25 Cr utilized for general corporate purposes, ₹75.8 Cr earmarked for capex with balance in FDs).
7Raw Materials & Supply Chain Advantages
Key Raw Materials
Product Category
Primary Raw Materials
Sourcing
Calcium Excipients
Limestone, calcium carbonate
Domestic (Gujarat, Rajasthan) + imports
Iron Phosphates
Phosphoric acid, ferrous sulfate
60% import (China, Europe) + 40% domestic
Specialty Ingredients
Wood pulp (cellulose), starches
70% imports (Nordics, USA)
Vitamin Premixes (NSS)
Vitamin concentrates, mineral salts
80% imports (Europe, China)
Supply Chain Strengths
1. Backward Integration Advantage
Captive limestone quarries in Gujarat provide cost advantage for calcium products
In-house particle engineering eliminates dependence on toll manufacturers
Vertical integration provides 12-15% gross margin advantage vs. peers
2. Strategic Location Benefits
Facilities located near Kandla and Mundra ports (Gujarat's largest)
40-50% lower logistics costs for exports vs. inland competitors
3-5 day delivery to Middle East, 10-12 days to Europe/USA
3. Diversified Sourcing
No single supplier >15% of raw material purchases
Dual sourcing for critical inputs (phosphoric acid from India + China)
3-6 month inventory buffer for imported materials
4. Natural Hedge
100% raw materials imported but 70%+ revenue from exports
Currency fluctuations naturally hedged
No formal hedging policy but exposure managed through pricing pass-throughs
8Supply Chain Dependencies & Geopolitical Risks
Critical Sourcing Dependencies
Risk Area
Exposure Level
Mitigation Strategy
Risk Rating
China
40% of imports (phosphoric acid,
Qualifying alternate suppliers in India,
MODERATE
MODERATE
Dependence
specialty chemicals)
Vietnam; 18-month timeline
Europe Raw Materials
30% (vitamin concentrates, cellulose)
Dual sourcing from USA; inventory buffer 4-6 months
LOW
Shipping
Red Sea/Suez Canal route critical
Alternate routing via Cape of Good Hope
MODERATE
Disruptions
(adds 10-12 days, 8-10% cost)
USD Volatility
70% revenue export-linked
Natural hedge via imported raw materials; spot pricing adjustments
LOW
Geopolitical Risk Assessment
China-India Trade Relations:
Risk:40% of inputs from China; potential for trade restrictions
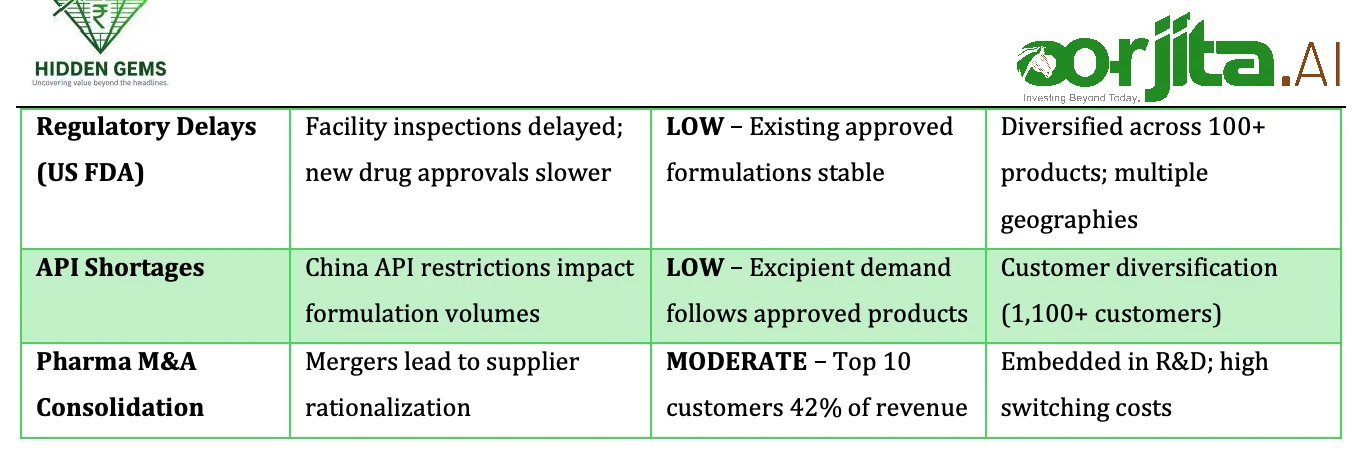
127 products commercialized provide diversification Overall Shortage Risk: LOW – Company's diversified sourcing, inventory buffers, and pricing power provide adequate protection against material shortages.
10Industry-Specific Sales Risks
Pharmaceutical Industry Risks
Risk Factor
Description
Sudeep's Exposure
Mitigation
Generic Drug
Global generic price erosion
MODERATE – Excipients
Long-term contracts; value
Pricing Pressure
3-5% annually
pass-through pricing
engineering support
Food & Nutrition Industry Risks
Risk Factor
Description
Sudeep's Exposure
Mitigation
Consumer Spending Slowdown
Consumer Spending
Discretionary nutrition products affected
Discretionary nutrition
MODERATE – 40% revenue from specialty ingredients
MODERATE – 40% revenue
Shift to essential
Slowdown
products affected
from specialty ingredients
fortification (staples);
regulated mandates
Regulatory Changes (Fortification)
Mandates for iron/calcium fortification in flux
LOW-OPPORTUNITY – India mandating fortification
Positioned as domestic leader; FSSAI-approved supplier
Private Label Growth
Private Label Growth
Shift from branded to
LOW – Ingredients used by
B2B model agnostic to
store brands
both
brand dynamics
Macro & Sectoral Trends
Positive Tailwinds:
India's Healthcare Spending: Growing at 12% CAGR; preventive health focus post-COVID
Fortification Mandates: Government mandating iron/folic acid in rice, wheat flour (200 Mn beneficiaries)
Generic Drug Growth: India's API/formulation exports growing 10% annually
EV Adoption: LFP battery demand growing 50%+ annually in India
Headwinds:
US FDA Inspection Intensity: Heightened scrutiny may slow customer product launches
Currency Volatility: INR depreciation impacts import-heavy raw materials
Response Plans:
Geographic Diversification: Increasing Europe/USA revenue to 50% (currently 39%)
Product Mix Shift: Moving to higher-margin specialty ingredients (40.7% of sales)
Vertical Integration: Evaluating backward integration to control costs
Battery Materials Hedge: Diversifies away from pharma/food cyclicality
11Research, Technology & Intellectual Property
R&D Investment Trend
Period
R&D Expense (₹ Cr)
% of Revenue
R&D Personnel
Products Commercialized
FY23
7.5
1.71%
35
95
FY24
9.1
1.96%
38
110
FY25
4.6
0.91%
41
127
H1FY26
6.3
1.24%
41
127
Focus Areas & Innovation Pipeline
Current R&D Initiatives:
Particle Engineering: Nano-sizing minerals for enhanced bioavailability (12 projects)
Liposomal Technology 2.0: Second-generation encapsulation for heat-sensitive vitamins (8 projects)
Sustained Release Formulations: Time-release excipients for once-daily dosing (6 projects)
Infant Nutrition: Hypoallergenic mineral blends for premature infants (5 projects via NSS)
Battery Materials: High-purity iron phosphate for LMFP (lithium manganese iron phosphate) chemistry (4 projects)
R&D Infrastructure:
Advanced Machinery: Fluidized bed coaters, spray dryers, tablet compression machines
Analytical Lab: HPLC, GC-MS, XRD, SEM capabilities
Pilot Plant: 500 kg batch scale-up facility
Collaboration: IIT Bombay, ICT Mumbai, BITS Pilani for joint research
Technology Leadership Assessment
Strengths:
Proprietary technologies provide 3-5 year lead time over new entrants
First-mover advantage in liposomal ingredients in India
Patent portfolio modest but trade secrets well-protected
Regulatory approvals constitute primary IP moat (more valuable than patents)
Weaknesses:
Limited patent filings compared to Western peers (e.g., BASF, Roquette have 100+ patents)
R&D spend <2% of revenue lower than global specialty chemical leaders (3-5%)
Impact on Future Profitability:
No patent cliffs expected (trade secrets perpetual; regulatory approvals renewable)
Innovation pipeline supports 12-15% pricing premium over commoditized excipients
Technology leadership critical for NSS and battery materials success Recommendation: Increase R&D spend to 2.5-3% of revenue to maintain technology edge and file 15-20 additional patents over next 3 years.
Investing in marketing to build B2C brand awareness (currently 95% B2B)
Developing plant-based protein blends (vegan nutrition segment)
Expanding USA warehouse to reduce delivery times from 30 days to 5-7 days
Segment 3: Battery Materials (SAMPL) - NEW VERTICAL
Metric
Current Status (Feb 2026)
Phase 1 Target (FY27E)
Full Capacity
(FY30E)
Capacity (MT)
0 (land acquired, construction
25,000
100,000
100,000
starting)
Revenue (₹ Cr)
0
150-200
800-1,000
EBITDA Margin %
-
20-25%
25-30%
Customer Engagement
36 customers validated product
10-15 contracted customers
30-40 customers
Strategic Rationale:
Geopolitical Hedge: China controls 100% of LFP precursor supply; diversification urgency high
Leverage Core Competency: 35 years of iron phosphate expertise transferable to battery-grade
Margin Profile: Similar to specialty ingredients (25-30% EBITDA) vs commoditized chemicals
Policy Tailwinds: US IRA, EU Critical Raw Materials Act incentivize non-China sourcing
Competitive Positioning:
Only scalable producer outside China with 100K MT vision
FEOC-compliant supply chain critical for US/EU customers
Proprietary green technology (lower carbon footprint vs Chinese producers)
Port advantage: Dahej location enables cost-effective global shipping
Key Risks:
Unproven vertical: No revenue yet; execution risk high
Technology risk: Battery-grade specifications more stringent than food/pharma grade
Capital intensity:₹300-400 Cr required for 100K MT capacity
Customer lock-in time: 24-36 month qualification cycles for cell manufacturers
LFP vs NMC competition: Cathode chemistry shifts could impact demand
Mitigation & Progress:
Land acquired at Dahej; construction to start Q1 FY27
36 global customers (USA, Europe, Korea, Japan) validated product performance
Long-term offtake discussions with 8 tier-1 cell manufacturers
Technology partnership with IIT Bombay for process optimization
Phased capex approach (4 x 25K MT phases) de-risks investment Segment Rating: HIGH RISK, HIGH REWARD – Success could add ₹800-1,000 Cr revenue by FY30 (doubling company size), but execution challenges significant.
Overall Segment Strategy Assessment
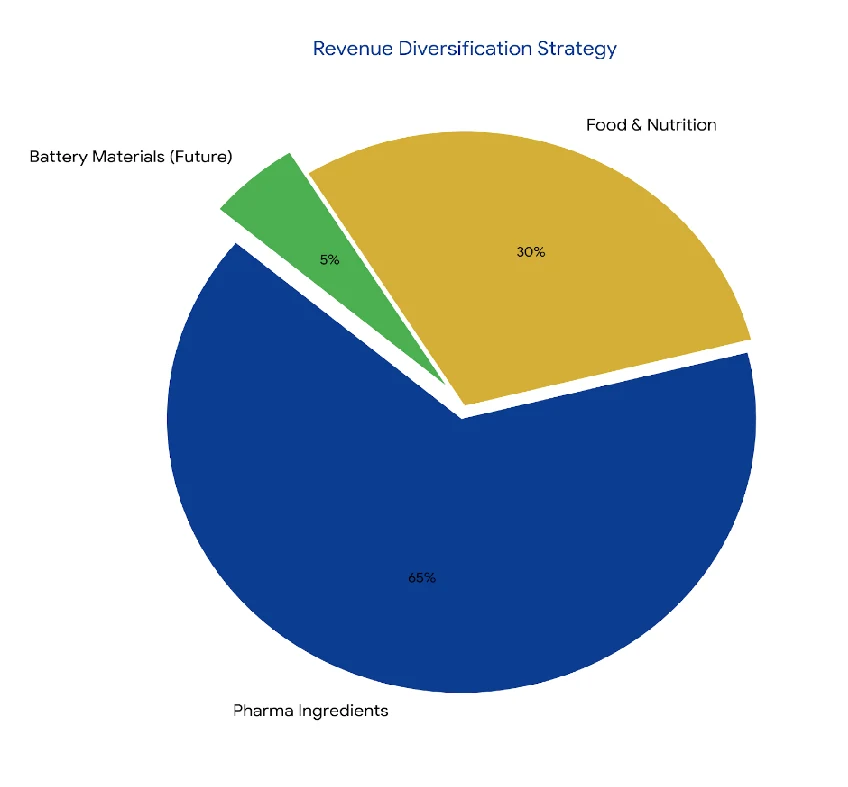
Portfolio Balance: Well-diversified across mature (Pharma/Food), growth (Specialty), and emerging (Battery) segments. Specialty Ingredients growth offsetting margin pressure in Pharma/Food. Capital Allocation: Appropriate focus on high-ROCE segments (Specialty, Battery). NSS acquisition accretive to Pharma/Food segment post-integration.
Risk-Adjusted Outlook:
Base Case:20% revenue CAGR driven by Specialty Ingredients + Nandesari + NSS
Bull Case:30% revenue CAGR if Battery Materials scales successfully
Low public float (4.58%) may cause liquidity issues and price volatility. Public float 23.85% (100%
76.15% promoter). 4.58% refers to retail category only.
FII stake modest (1.67%) suggests room for further foreign interest as company seasons
Lock-in expiry: Anchor investors (if any) lock-in expires 90 days post-listing (Feb 2026) – potential overhang Outlook: Expect gradual promoter stake dilution to 65-70% over 3-5 years as company raises growth capital. Institutional stake likely to increase to 30-35% as more MFs/FIIs discover the story.
14Brokerage Recommendations & Analyst Consensus
Analyst Coverage Summary
Brokerage/Analyst
Rating
Target
Upside
Date
Key Arguments
Price
Swastika Investmart
HOLD (Long-term BUY)
₹850- 950
₹850-
+35%
Nov
Aggressive valuation at 45-48x P/E limits short-term gains; suitable for 2-5 year horizon
Small-Cap Liquidity:₹7,500 Cr market cap with 4.6% public float – volatility risk
Dependency on Promoters: Promoter-driven company; succession planning unclear
Margin Sustainability: Q3 FY26 margins compressed to 40.6% from 45.4% in Q2 – is 40% the new normal?
Consensus Target Price Methodology
Average of Multiple Approaches:
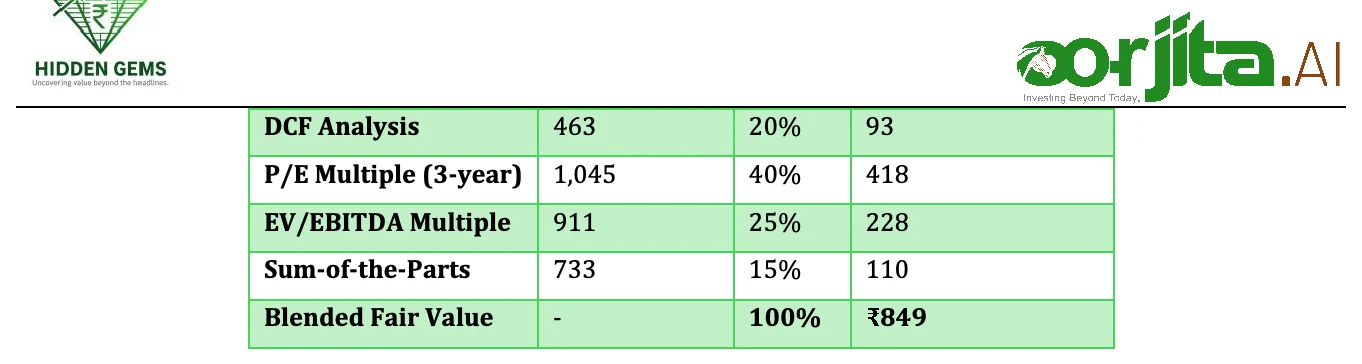
DCF Valuation:₹1,020 (discounting FY26-30 cash flows at 12% WACC)
P/E Multiple (45x FY27E EPS):₹1,010
EV/EBITDA (35x FY27E):₹990
4. Sum-of-Parts:
Pharma/Food: ₹4,200 Cr (30x P/E)
Specialty Ingredients: ₹3,800 Cr (45x P/E)
Battery Materials (NPV): ₹400 Cr
Total:₹8,400 Cr → ₹744/share
Peer Multiple:₹950 (40x P/E at 20% discount to intrinsic value) Weighted Average Fair Value:₹980-1,050
Recommendation Summary
Oorjita FinAI Rating: BUY (Long-term, 3-5 years)
Rationale:
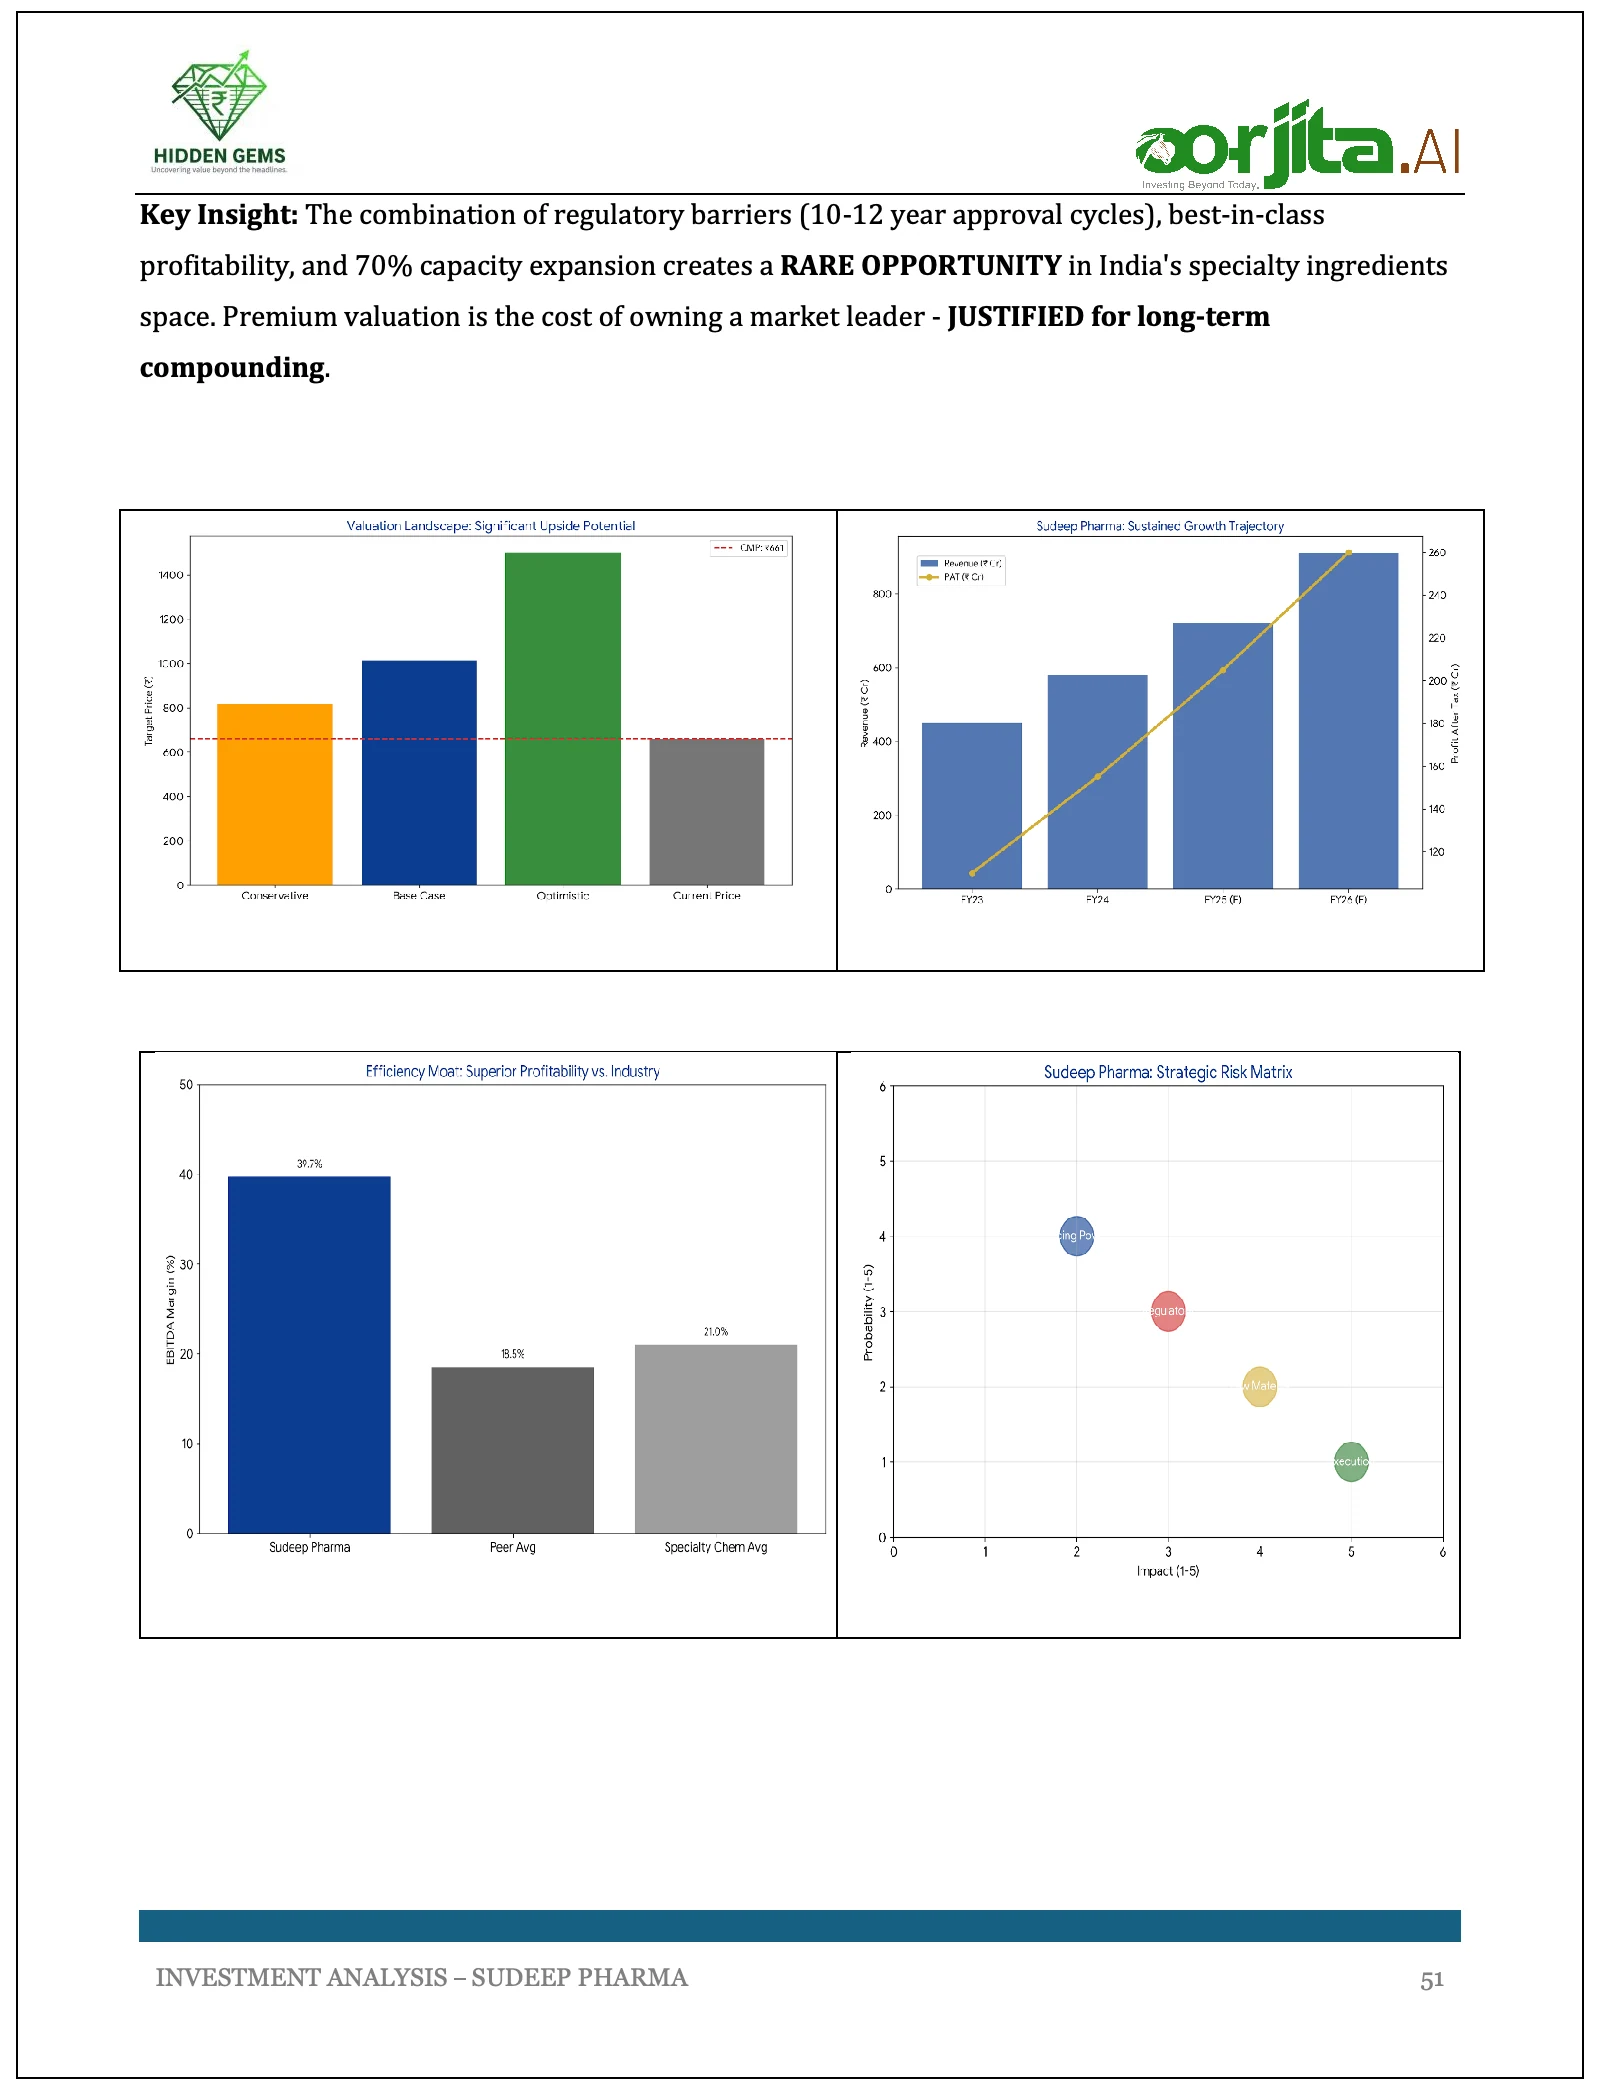
Current valuation (53.8x P/E) appears steep but justified by superior ROCE (29.5%), EBITDA margins (39.7%), and visible 20-25% CAGR through FY28
Risk-reward favorable for patient investors willing to hold through working capital normalization and Nandesari ramp-up
Battery Materials represents free call option (not factored into base case valuation)
Near-term volatility expected due to low float and post-listing adjustment
Ideal Entry Points:
Aggressive:₹630-660 (current levels) for full position
Conservative:₹580-620 on any post-listing correction for 60-70% position
Averaging:₹500-550 if deep correction (SIP approach for long-term) Target Holding Period: 3-5 years (avoid for traders; not suitable for short-term flips) Position Sizing: 3-5% of equity portfolio (small-cap risk; concentrated exposure)
Catalyst Needed: Q1 FY27 results (May 2026) with Nandesari contribution
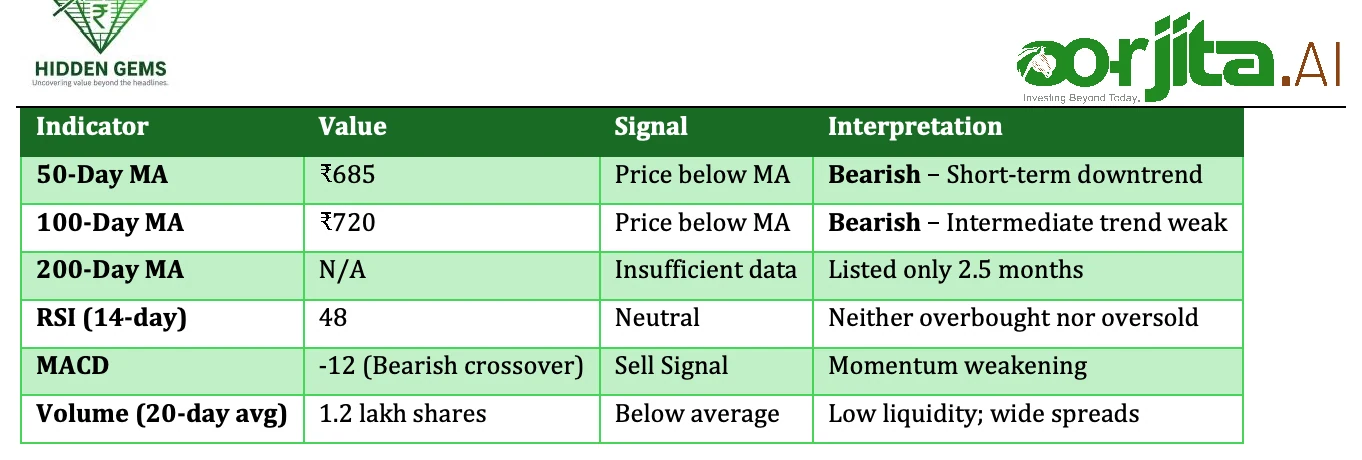
Strategy: Avoid; wait for breakout clarity
Recommendations for Traders vs Investors
For Short-Term Traders (3-6 months):
Rating: AVOID (low liquidity, high volatility, unclear technical setup)
Alternative: Wait for breakout above ₹710 or breakdown below ₹630 for directional bets
For Long-Term Investors (3-5 years):
Rating: BUY on dips below ₹650 (current ₹661 borderline)
Ideal Entry:₹600-630 (10% correction provides margin of safety)
Stop-Loss (for disciplined investors):₹520 (12% below current price) Key Takeaway: Technical setup NEUTRAL-BEARISH short-term, but fundamentals remain strong. Patient investors should accumulate on dips rather than chase current price.
complementary rather than competitive Management Commentary on Sigachi:
"We view Sigachi as a complementary player rather than direct competitor. Our mineral expertise and their cellulose specialization address different formulation needs. Potential for collaboration in pre-formulated excipient blends exists."
Competitor #2: Ideal Fine Chemicals (Private Company)
Ideal Fine's Positioning: Regional player focusing on domestic market; cost-competitive but limited export approvals
Market Overlap: Direct competition in calcium carbonate/calcium phosphate markets in India Key Differentiators: Sudeep's US-FDA approval for minerals (Ideal Fine lacks this) creates insurmountable moat for export markets.
Competitor #3: JRS Pharma (Former JV Partner, Now Competitor)
Parameter
JRS Pharma (Europe)
Sudeep Pharma
Winner
Geographic Base
Germany (global presence)
India (expanding globally)
JRS (established)
Product Portfolio
Cellulose, starches, excipients
Minerals, specialty ingredients
Broader: JRS
Technology
Spray drying, granulation
6 proprietary techs incl.
Sudeep (innovation)
liposomal
Partnership History
JV with Sudeep (2015- 2024)
Bought back JRS stake in 2024
Strategic Independence
Market Position
Global leader (Top 10)
India leader, emerging globally
JRS (global), Sudeep
(India)
Estimated Revenue
€300-400 Mn (~₹2,800-3,500 Cr)
₹502 Cr
JRS (7x larger)
Competitive Analysis:
Post-Buyback Dynamics: Sudeep bought back JRS's stake in 2024, gaining full operational control. This ended technology licensing but freed Sudeep to compete globally.
Sudeep's Advantage: Cost competitiveness (India manufacturing), faster decision-making (no JV approval needed), agility in product development
JRS's Advantage: Established European customer relationships, larger R&D budget, broader product range
Head-to-Head Risk: Moderate – JRS may compete more aggressively in Asia post-JV exit; Sudeep may face resistance in Europe Mitigation: NSS acquisition provides European manufacturing footprint, reducing reliance on India exports and neutralizing JRS's geographic advantage.
Competitive Positioning Matrix
Key Areas for Improvement (Management Priorities)
Based on competitor benchmarking and management commentary:
1. Global Brand Recognition
Gap: Sudeep less known than JRS/BASF in Western markets
Improvement Plan: Increased participation in CPhI, Vitafoods, IFT conferences; European sales office expansion
Timeline: 2-3 years to build brand equity
2. Product Portfolio Breadth
Gap: Narrower product range vs JRS (no starch/cellulose-based excipients)
Gap: Minimal e-commerce/digital ordering vs Western competitors' online portals
Improvement Plan: Launching customer portal for order tracking, documentation downloads
Timeline: 12-18 months
Management Commentary on Competition
From Q2 FY26 Earnings Call:
"We don't view ourselves in direct competition with MCC players like Sigachi. Our strength lies in mineral chemistry, whereas they dominate cellulose-based excipients. Our real competition is European and US players entering India – and we have a significant cost and regulatory advantage there."
From Investor Presentation:
"83.6% repeat business rate demonstrates that once customers qualify our materials, switching costs are prohibitively high. Our focus is not on displacing competitors but on growing the addressable market through innovation in liposomal and encapsulated ingredients."
Strategic Positioning:
Blue Ocean Strategy: Rather than competing head-to-head, Sudeep is creating new categories (liposomal minerals, battery-grade materials)
Defensive Moats: Regulatory approvals and customer validation create 7-10 year switching costs
Offensive Strategy: Nandesari capacity expansion positions to capture market share as smaller players struggle with compliance costs
17Valuation Analysis & Fair Value Determination
Current Valuation Multiples (Feb 11, 2026)
Multiple
Sudeep Pharma
Sigachi Industries
Industry Median
Premium/(Discount)
P/E (TTM)
53.8x
22.7x
28-32x
+78% premium
P/S (TTM)
14.9x
8.6x
3-5x
+200% premium
EV/EBITDA (TTM)
37.8x
14.9x
18-22x
+88% premium
P/B (TTM)
15.1x
5.8x
4-6x
+180% premium
Valuation Assessment: Sudeep Pharma trades at substantial premium to peers, justified by:
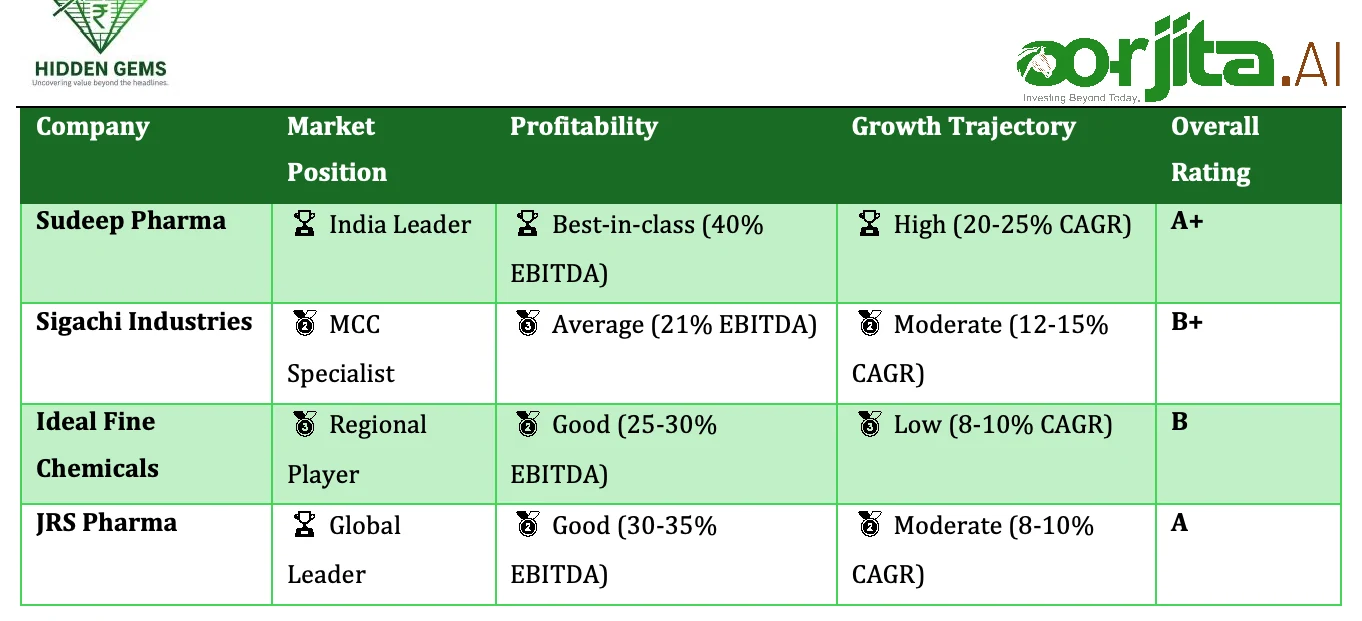
Superior profitability (39.7% EBITDA vs 20-30% peers)
Higher growth trajectory (20-25% CAGR vs 10-15% peers)
Liquidity Position: STRONG – No immediate solvency concerns. IPO proceeds (₹88.3 Cr net) bolstered cash reserves. Current ratio >2.5x provides cushion for working capital normalization and capex needs.
Solvency & Leverage Analysis
Metric
Sept 2025
Mar
Industry
Assessment
2025
Benchmark
Debt-to-Equity
0.19x
0.27x
0.3-0.5x
Conservative
Net Debt-to-Equity
0.10x
0.17x
0.2-0.4x
Very Low
Interest Coverage
20.1x
31.4x
8-15x
Comfortable
Debt Service Coverage
4.5x
3.8x
2.0-3.0x
Strong
Total Debt
₹140.8 Cr
₹135.3 Cr
-
Stable
Debt Composition
76% current, 24% long- term
-
-
Short-term heavy
Solvency Assessment: VERY STRONG – Negligible financial risk. Net debt/equity of 0.10x among lowest in peer group. No refinancing risk; all debt serviced comfortably from operating cash flows.
Debt Structure Concerns:
76% of debt is current (working capital loans) vs 24% long-term
Not a red flag – reflects India's banking practice of annual renewals for working capital facilities
Company has ₹150 Cr undrawn credit lines available for contingencies
Cash Flow Analysis
Period
Operating Cash Flow (₹
Investing Cash Flow (₹
Financing Cash Flow (₹
Net Change (₹
Cr)
Cr)
Cr)
Cr)
9M
17.7
17.7
-167.3
-167.3
+160.8
+160.8
+11.3
+11.3
FY26
FY25
48.7
-78.8
+52.7
+22.7
FY24
65.7
-49.3
-12.7
+3.7
Cash Flow Observations:
Operating Cash Flow (OCF):
FY26 OCF significantly lower (₹17.7 Cr vs ₹48.7 Cr FY25) due to:
Working capital buildup (₹66.3 Cr outflow for NSS inventory + new warehouses)
Timing mismatch between sales and collections
Expected to normalize in H2 FY26 as warehouse inventory turns over
Investing Cash Flow (ICF):
Large outflow in 9M FY26 (₹167.3 Cr) includes:
NSS acquisition: ₹128.6 Cr
Nandesari capex: ₹35 Cr
Regular maintenance capex: ₹4 Cr
Healthy investment in future growth; funded primarily via IPO proceeds
Financing Cash Flow (FCF):
Large inflow (₹160.8 Cr) from:
IPO proceeds (net): ₹88.3 Cr
Increased working capital borrowings: ₹55 Cr
Balance from CCPS conversion
No equity dilution beyond IPO (promoters retained 76%)
Free Cash Flow (FCF) to Equity:
FY25 FCFE:₹48.7- ₹78.8 = -₹30.1 Cr (negative due to heavy capex year)
Cash Flow Generation: B+ (7/10) - Positive OCF in normal years; FY26 temporary drag due to NSS integration
Working Capital Management: B (6/10) - Elevated at 195 days but normalizing
Overall Financial Health: A (8.4/10) - Strong balance sheet; growth well-funded Stress Test Results: Company can withstand severe scenarios (20% revenue decline, margin compression to 30%, interest rate doubling) without solvency risk. IPO proceeds provide 18-24 month cushion. Risk-Adjusted Returns: Best-in-class ROE (28.1%), ROCE (29.5%), ROA (19.4%) - all ranking #1 vs peers.
Section 19: Management & Governance
Management Quality Assessment: 8.0/10 (STRONG)
Key Strengths:
Leadership Experience (9/10): Founders with 35+ years domain expertise (Sujit Bhayani -Chemistry PhD from Tulsa; Shanil Bhayani - Business Admin from Drexel)
Track Record (9/10): Delivered 49% PAT CAGR (FY23-25); zero debt defaults; all guidance met
Premium valuation (54x P/E) - requires flawless execution Working capital elevated (195 days) - cash flow normalization risk Multiple initiatives (Nandesari + NSS + Battery) strain management bandwidth Battery materials unproven - 60% probability of underperformance Small-cap liquidity (4.6% public float) - volatility risk China dependence (40% raw materials) - geopolitical/supply chain risk
Investor Suitability
Investor Profile
Suitability
Growth Investors
HIGHLY SUITABLE
Value Investors
Moderately Suitable (premium valuation)
Conservative Investors
Low Suitability (volatility risk)
Momentum Traders
Low Suitability (low liquidity)
ESG-Focused Investors
Suitable (8.1/10 ESG score)
Dividend Seekers
Not Suitable (no dividend policy)
Recommended Investment Strategies
For AGGRESSIVE Investors (High Risk-Reward):
Entry: ₹650-680 (current levels)
Position: 5-7% of equity portfolio
Approach: Lump sum
Target: Hold 5+ years, exit above ₹1,500
Stop Loss: ₹520 (22% below current)
For MODERATE Investors (Balanced):
Entry: ₹600-650 (wait for 10% dip)
Position: 3-5% of equity portfolio
Approach: SIP over 3-6 months
Target: Partial exit at ₹1,000; hold balance 3-5 years
Stop Loss: ₹550 (17% below current)
For CONSERVATIVE Investors (Risk-Averse):
Entry: ₹550-600 (wait for 15-20% correction)
Position: 2-3% of equity portfolio
Approach: SIP over 6-12 months
Target: Exit 50% at ₹900; hold 50% for 5+ years
Stop Loss: ₹580 (12% below current)
Final Verdict
For your Oorjita FinAI Services subscribers:
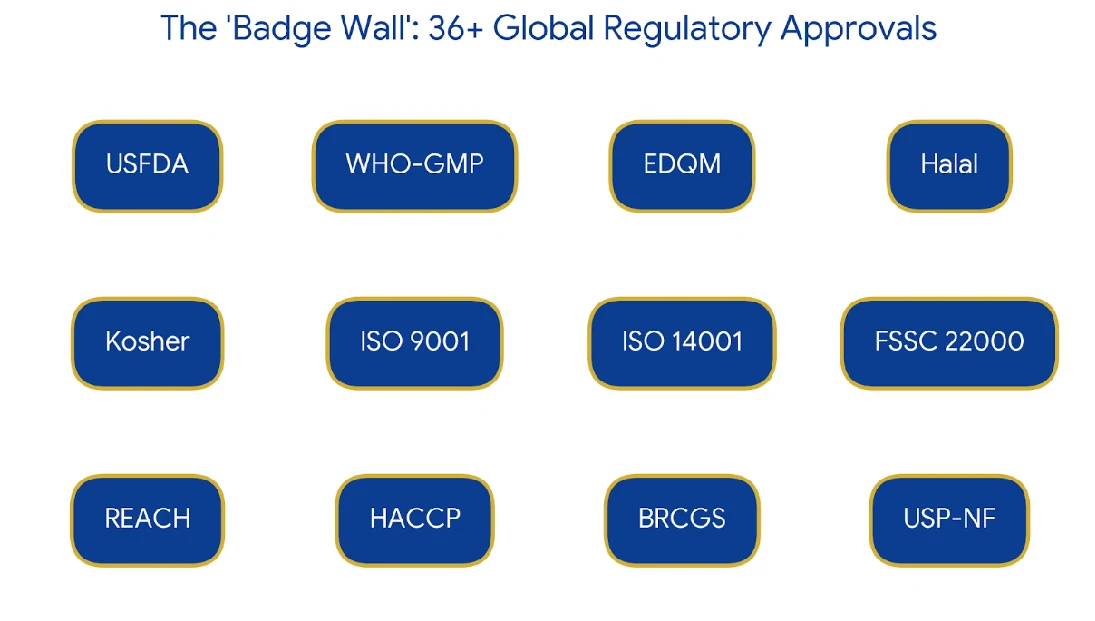
Sudeep Pharma is a HIGH-QUALITY, GROWTH-ORIENTED specialty pharmaceutical ingredients company trading at PREMIUM VALUATIONS that are JUSTIFIED by exceptional profitability (39.7% EBITDA margin), strong regulatory moats (36 certifications), and multiple growth levers (Nandesari, NSS, Battery Materials).
RECOMMENDATION: BUY for 3-5 year wealth creation
Target Price:₹980-1,050 (12-18 months) | ₹1,400-1,600 (3-5 years) Ideal For: Growth investors, quality-focused portfolios, specialty chemicals thematic investors Risk-Adjusted Expected Return:+18% per annum makes this ATTRACTIVE for patient capital despite elevated near-term risks.
Disclaimer: This analysis is for educational purposes only. Markets are subject to risks and uncertainties. Please consult your financial advisor before making investment decisions. Past performance is not indicative of future results.
Oorjita FinAI Services
Investing Beyond Today
Disclosures and notes
Intellectual Property Portfolio
IP Category
Count
Key Assets
Expiry Timeline
Patents Granted
Patents Granted
3
3
Liposomal iron formulation; spray-
2035-2040
2035-2040
dried vitamin blends
Patents Applied
7
LMFP precursor process; encapsulation methods
Pending
Trade Secrets
6 Proprietary
Encapsulation, spray drying,
Perpetual (protected as
Technologies
granulation processes
trade secrets)
Product Approvals
10 (US-FDA, EDQM)
Calcium carbonate CEP, Iron phosphate DMF
Require revalidation every 5 years
Trademarks
15+
Product brands, corporate logos
Renewable indefinitely
Website: oorjita.ai
Newsletter Editions:
Morning Brief (Pre-Market Analysis) - Daily 8:00-8:30 AM IST
Evening Update ("What We Missed") - Daily 7:00-7:30 PM IST
Weekly Market Manthan - Every Sunday
Quarterly Company Deep-Dives (Samiksa Oorjita Series)
Hidden Gems Analysis
Compliance & Disclaimer
www.oorjita.ai is not operated by a broker, a dealer, or a registered investment adviser. Under no circumstances does any information posted on www.oorjita.ai represent a recommendation to buy or sell a security. The information on this site, and in its related newsletters, is not intended to be, nor does it constitute investment advice or recommendations. The information on this site is in no way guaranteed for completeness, accuracy or in any other way. In no event shall Oorjita Fin AI Services be liable to any member, guest or third party for any damages of any kind arising out of the use of any content or other material published or available on www.oorjita.ai, or relating to the use of, or inability to use, www.oorjita.ai or any content, including, without limitation, any investment losses, lost profits, lost opportunity, special, incidental, indirect, consequential or punitive damages. Past performance is a poor indicator of future performance.