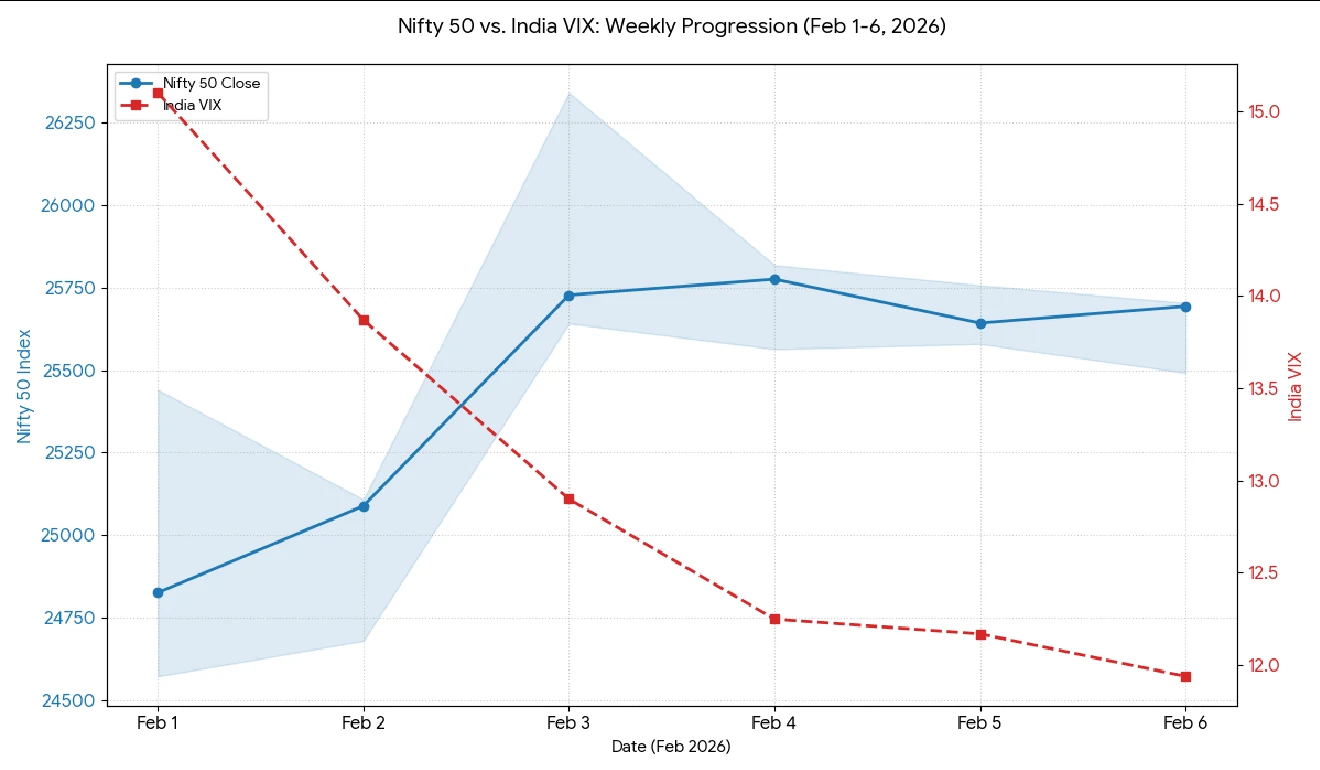
Dual-axis chart showing Nifty 50 gaining +3.50% while India VIX collapsed -20.93%. The inverse relationship reveals market conviction returning—not just price recovery, but fear dissipating.

This research is for information and education only and is not investment advice. Figures may be provisional. Oorjita.AI and its authors may hold positions in securities mentioned. Please consult a SEBI-registered investment adviser before making investment decisions. Published Saturday, 7 February 2026, 9:13 PM IST.

Bearish Marubozu — A candlestick with no upper shadow and a minimal lower shadow. It signals relentless selling from open to close with zero buying recovery.

Morning's Bear call was directionally validated, but the intraday recovery depth was underestimated. The market found its panic floor exactly where the morning brief mapped it — and then bounced.

On February 25, the US Department of Commerce announced preliminary countervailing duties (CVD) of approximately 126% on Indian solar module imports.
Daily Progression: The week began with fear (Monday's -2.01% drop to 24,825.45), saw violent recovery Tuesday (opening gap-up to 26,308, hitting week high 26,341.20), then consolidated through week-end.
DAVANGERE Sugar: Arihant Capital bought 20.5 million shares @ ₹4.20 (distressed asset play)
Use of Proceeds: Expansion of manufacturing capacity (65%), working capital (25%), general corporate purposes (10%)
Kill-Switch: Fed maintains hawkish tone beyond March FOMC; INR sustains below 90.
Week: 01-Feb-2026 → 06-Feb-2026 | Edition #6 | Saturday, February 7, 2026 Powered by: Oorjita FinAI Services
| Metric | Value | Weekly Change |
|---|---|---|
| Nifty 50 | 25,693.70 | +3.50% ↑ |
| Nifty Bank | 60,120.55 | +2.92% ↑ |
| Nifty Midcap 100 | 59,502.70 | +4.17% ↑ |
| Nifty Smallcap 100 | 16,938.65 | +3.17% ↑ |
| India VIX | 11.94 | -20.93% ↓ |
| USD/INR (FBIL) | 90.4163 | -1.61% (INR strengthened) |
| FII Flows | +₹2,646 cr | Net buyers |
| DII Flows | +₹2,892 cr | Net buyers |
| Combined Flows | +₹5,538 cr | Strong institutional support |
Table 1: Market Summary - Week of Feb 1-6, 2026
The Indian equity markets staged a powerful recovery this week, with Nifty 50 gaining 3.50% to close at 25,693.70—rebounding sharply from Monday's capitulation at 24,571.75. Broad-based buying across market capitalizations drove the rally, supported by collapsing volatility and
Daily Progression: The week began with fear (Monday's -2.01% drop to 24,825.45), saw violent recovery Tuesday (opening gap-up to 26,308, hitting week high 26,341.20), then consolidated through week-end. Volume spiked to 63.7 crore shares on Tuesday—the turnaround day—before normalizing to 37.5 crore by Friday.
| Index | Feb 1 | Feb 6 | Weekly % | P/E | P/B |
|---|---|---|---|---|---|
| Nifty 50 | 24,825.45 | 25,693.70 | +3.50% | 22.26 | 3.49 |

Table 2: Weekly Index Performance with Valuations (Feb 1-6, 2026)
| Date | Open | High | Low | Close | Daily % | Vol (cr) | VIX |
|---|---|---|---|---|---|---|---|
| Feb 1 (Sun) | 25,333.75 | 25,440.90 | 24,571.75 | 24,825.45 | -2.01% | 37.9 | 15.10 |
| Feb 2 (Mon) | 24,796.50 | 25,108.10 | 24,679.40 | 25,088.40 | +1.18% | 44.9 | 13.87 |
| Feb 3 (Tue) | 26,308.05 | 26,341.20 | 25,641.30 | 25,727.55 | -2.21% | 63.7 | 12.90 |
| Feb 4 (Wed) | 25,675.05 | 25,818.55 | 25,563.95 | 25,776.00 | +0.39% | 43.0 | 12.25 |
| Feb 5 (Thu) | 25,755.90 | 25,757.65 | 25,579.50 | 25,642.80 | -0.44% | 34.4 | 12.17 |
| Feb 6 (Fri) | 25,605.80 | 25,703.95 | 25,491.90 | 25,693.70 | +0.34% | 37.5 | 11.94 |
Table 3: Daily OHLC, Volume & VIX Progression
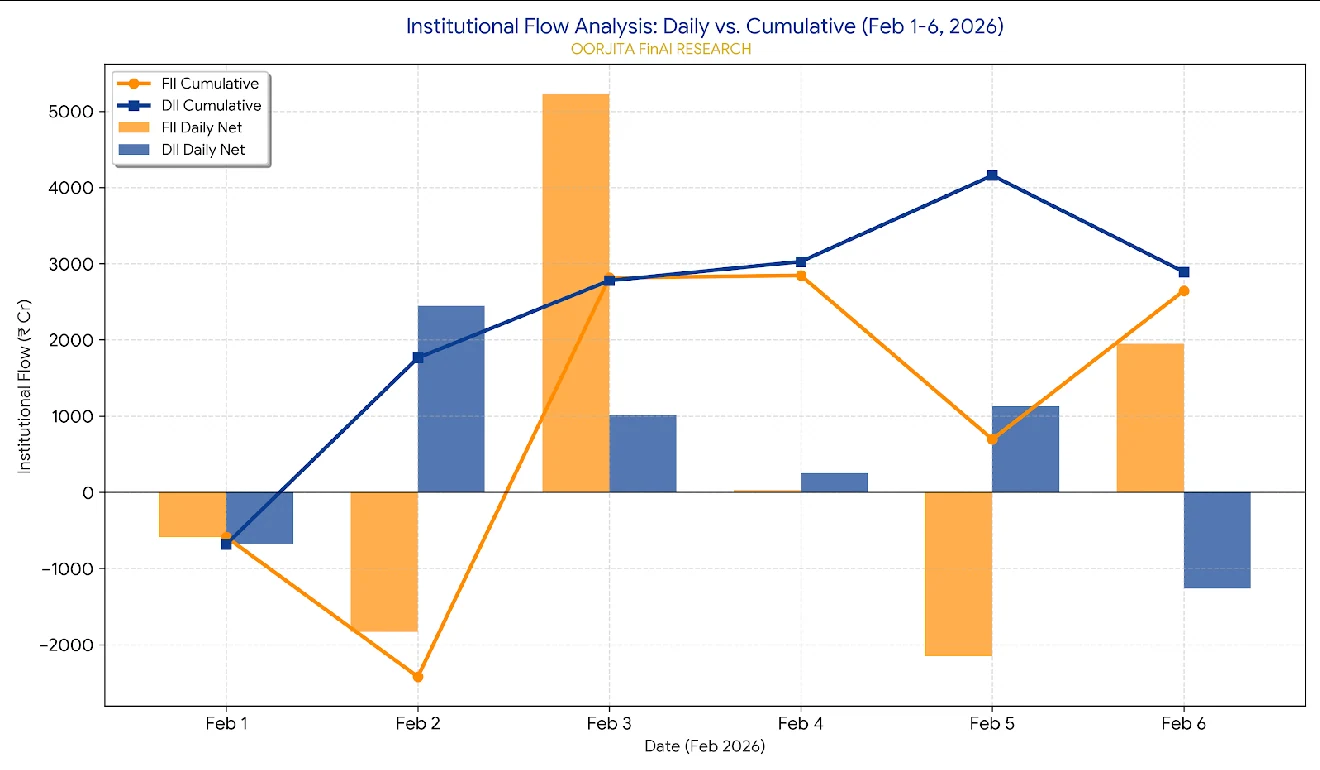
Week of Feb 1-6 marked the first week since late January where both FII and DII were net buyers—a rare alignment signaling conviction[4]:
| Date | FII Net (₹ Cr) | DII Net (₹ Cr) | Combined |
|---|---|---|---|
| Feb 1 (Mon) | -588.34 | -682.73 | -1,271.07 |
| Feb 2 (Tue) | -1,832.46 | +2,446.33 | +613.87 |
| Feb 3 (Wed) | +5,236.28 | +1,014.24 | +6,250.52 |
| Feb 4 (Thu) | +29.79 | +249.54 | +279.33 |
| Feb 5 (Fri) | -2,150.51 | +1,129.82 | -1,020.69 |
| Feb 6 (Sat) | +1,950.77 | -1,265.06 | +685.71 |
| Weekly Total | +2,645.53 | +2,892.14 | +5,537.67 |
Table 4: Daily FII-DII Flows (₹ Crores)
India VIX: Dropped 20.93% week-over-week, closing at 11.94 (from 15.10 on Feb 1). This signals:
8-Week VIX Context: Current 11.94 reading sits near the lower quartile of the 52-week range (8.72–23.19), indicating a "sleepy" regime—conducive to directional strategies but vulnerable to sudden shocks.
Market breadth remained negative despite the index rally—suggesting narrow leadership and potential fragility. Only 43% of stocks advanced on Friday, indicating gains concentrated in select large-caps and index heavyweights.
Overall Market Delivery % (Feb 6): 36.38% Total Traded Qty: 4.42 billion shares | Total Delivery: 1.61 billion shares
| Symbol | Close (₹) | Volume | Delivery % |
|---|---|---|---|
| MSCIINDIA | 30.60 | 2,985,786 | 99.99 |
| NUVOCO | 345.10 | 1,278,494 | 96.95 |
| LIQUIDCASE | 112.65 | 19,335,884 | 94.11 |
| DAVANGERE | 4.25 | 22,754,840 | 93.99 |
| LIQUIDBEES | 1,000.00 | 4,456,795 | 93.71 |
Table 5: Top High-Delivery Stocks (Volume > 5L) - Accumulation Pattern
| Symbol | Close (₹) | Volume | Delivery % |
|---|---|---|---|
| CONCORDBIO | 1,327.20 | 3,830,074 | 4.20 |
| GODFRYPHILP | 2,188.30 | 7,290,096 | 7.55 |
| SAILIFE | 849.80 | 4,339,405 | 8.92 |
| EIHOTEL | 348.05 | 15,170,115 | 9.47 |
| IZMO | 841.45 | 2,075,758 | 9.47 |
Table 6: Top Low-Delivery Stocks - High Speculation
| Symbol | Close (₹) | Volume | Delivery % |
|---|---|---|---|
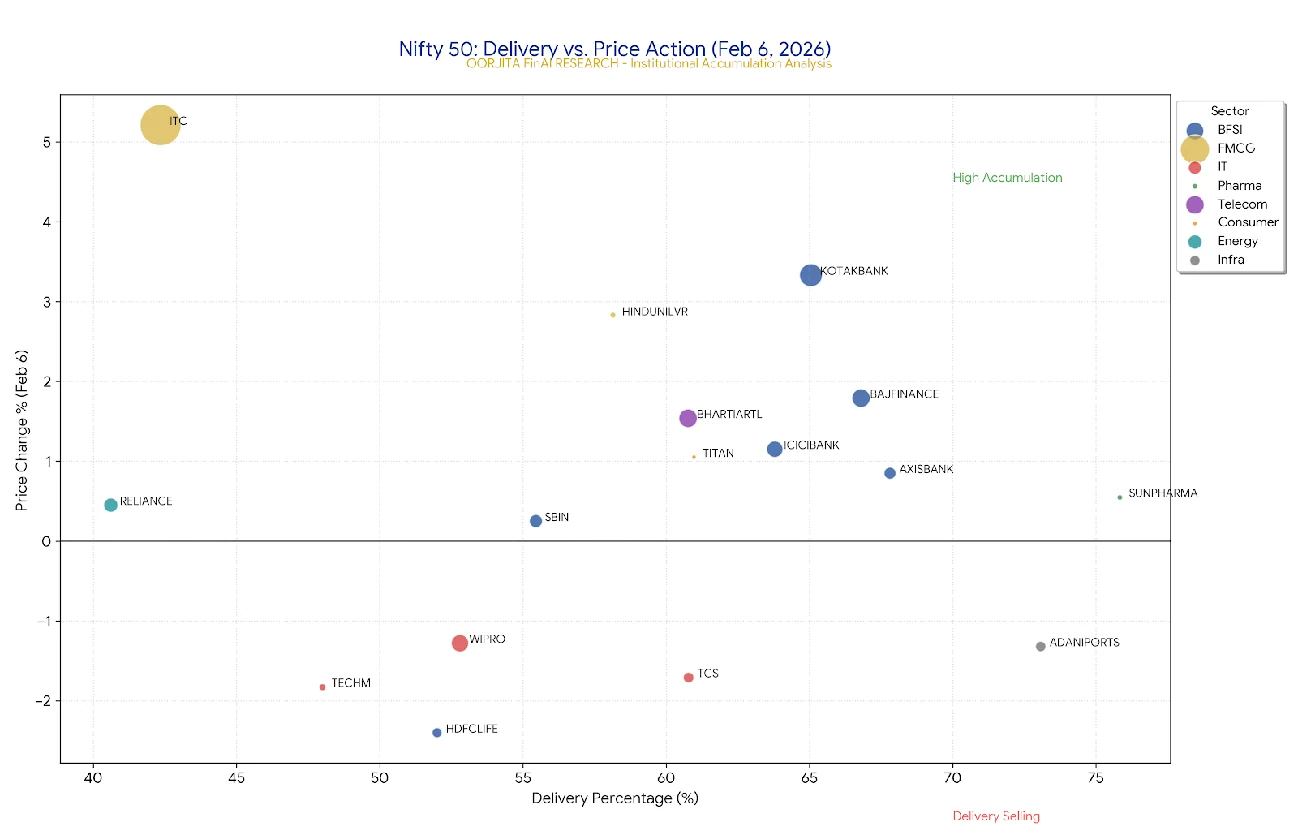
| SUNPHARMA | 1,695.10 | 1,277,116 | 75.83 |
| ADANIPORTS | 1,550.70 | 4,429,173 | 73.06 |
| AXISBANK | 1,341.60 | 5,876,574 | 67.81 |
| BAJFINANCE | 981.70 | 13,742,927 | 66.80 |
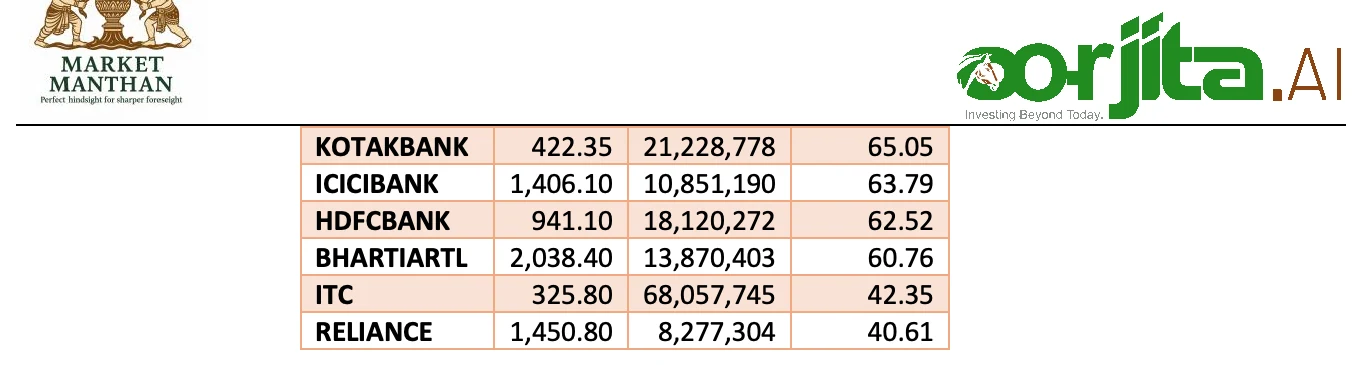
Table 7: Nifty 50 Stocks - Delivery Percentage
| Date | USD/INR |
|---|---|
| Jan 30 (Week Start) | 91.8983 |
| Feb 2 | 91.6443 |
| Feb 3 | 90.4495 |
| Feb 4 | 90.4693 |
| Feb 5 | 90.3957 |
| Feb 6 (Week End) | 90.4163 |
| Weekly Change | -1.4820 (-1.61%) |
Table 8: USD/INR Daily Progression
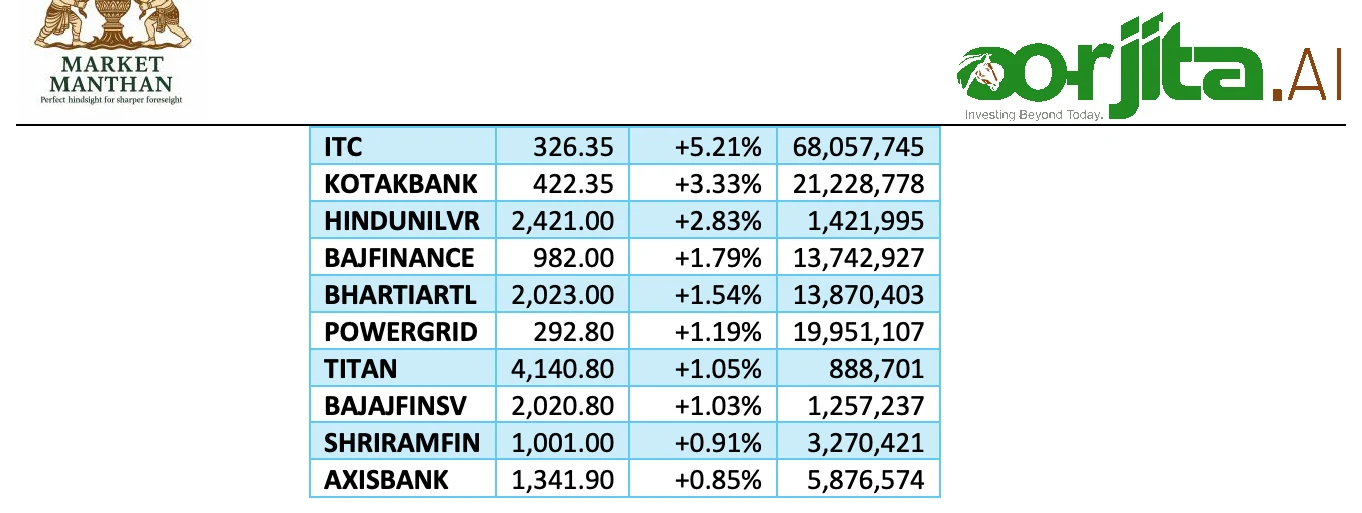
Table 9: Top 10 Nifty Gainers - Feb 6, 2026 Standout: ITC's 5.21% surge on massive volume (68 million shares) signals defensive rotation + rural demand optimism.
| Symbol | LTP (₹) | % Change | Volume |
|---|---|---|---|
| HDFCLIFE | 703.40 | -2.40% | 4,114,496 |
| TECHM | 1,616.00 | -1.83% | 1,988,639 |
| TCS | 2,940.30 | -1.71% | 4,687,389 |
| SBILIFE | 1,986.80 | -1.54% | 884,292 |
| TMPV | 368.90 | -1.40% | 23,116,970 |
| BAJAJ-AUTO | 9,517.50 | -1.34% | 198,790 |
| ADANIPORTS | 1,549.50 | -1.32% | 4,429,173 |
| WIPRO | 230.40 | -1.28% | 12,279,085 |
| ETERNAL | 283.55 | -1.15% | 29,937,539 |
| ASIANPAINT | 2,405.00 | -1.11% | 1,043,982 |
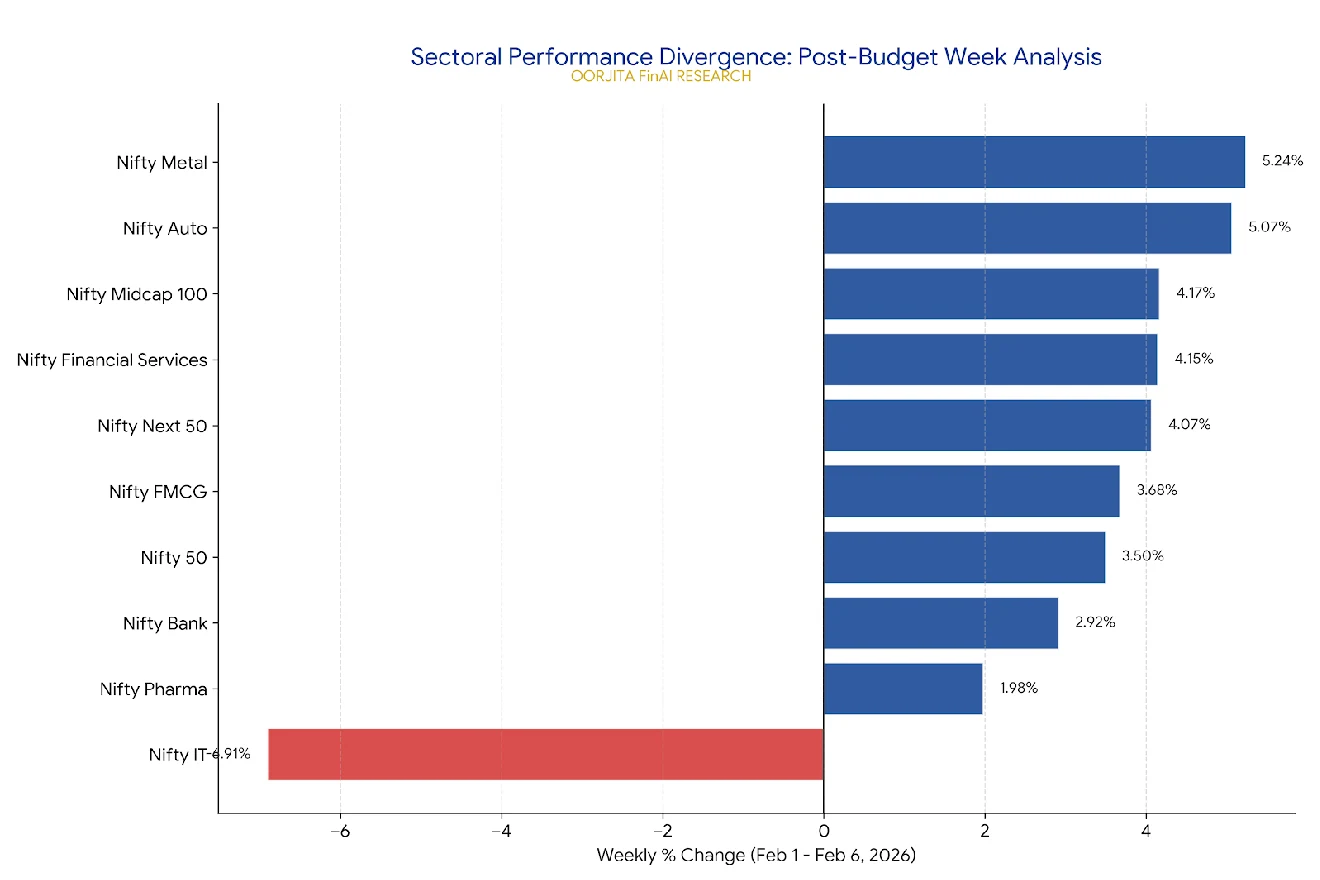
Table 10: Top 10 Losers - Feb 6, 2026 IT Sector Carnage: TCS (-1.71%), TECHM (-1.83%), WIPRO (-1.28%) all declined—capping off a brutal -6.91% weekly loss.
Stocks at 52-Week HIGH: 29 stocks Notable: APLAPOLLO (₹2,200), ADVAIT (₹1,624.90), GESHIP (₹1,271.40), CORONA (₹1,540)
Stocks at 52-Week LOW: 80 stocks Notable: AAVAS (₹1,302.10, -5.61%), AGI (₹594.50), ARISINFRA (₹83.30, -8.09%)
45 bulk deals reported. Key transactions:
Confidence: High — Official NSE bulk deal data.
The Reserve Bank of India's Monetary Policy Committee concluded its Feb 5-6, 2026 meeting with key takeaways[13]:
While Nifty 50 surged +3.50%, Nifty IT plunged -6.91%—the sharpest sectoral divergence in 12 weeks. Surface narrative blames dollar strength. Deeper story:
Opportunity or Trap? IT P/E compressed to 27.18 (from 28+ in January). If dollar stabilizes (DXY 102-104 range) and US recession fears ease, mean reversion trade active. Watch: March quarter earnings guidance (mid-April) for FY27 outlook.
Historical Context: This pattern typically emerges in mid-cycle recoveries where liquidity is ample but caution persists. Smallcap catch-up usually occurs 2-4 weeks later if momentum sustains.
Put-Call Ratio (Open Interest basis) for Nifty: Declined from 1.15 (Feb 1) to 0.92 (Feb 6)—indicating call buying dominance[14][15].
Max Pain for Feb expiry (Feb 13): 25,500 Market closed at 25,693.70 (above max pain)—suggests potential short squeeze into monthly expiry next week[15].
PCR Normalized: From panic levels (1.15+) to neutral-bullish (0.92)—options traders positioning for consolidation with upside bias.
INR appreciation (-1.61%) vs Dollar Index (flat to -0.3%) suggests India-specific factors at play:
Live Subscriptions (Feb 1-6):[16][17][18]
| IPO | Size (₹ Cr) | Price Band | Subscription | Status |
|---|---|---|---|---|
| Kasturi Metal | 17.6 | 61-64 | Moderate | Listed Feb 3 |
| Biopol Chemicals | - | 102-108 | 29.63x | Active (Feb 6-10) |
| PAN HR Solutions | - | 74-78 | 2.2x | Active (Feb 6-10) |
Table 11: IPO Activity - Week of Feb 1-6, 2026
The week saw muted mainboard IPO activity, with SME segment dominating[16][18]. Retail participation remained strong in small-ticket issues (Biopol Chemicals oversubscribed 29.63x as of Feb 6)[18], but institutional participation remained selective. Total capital attempted to raise this week: Estimated ₹50-75 cr across active issues (Confidence: Medium—provisional data).
QIB vs Retail Pattern: QIB caution on valuation-heavy issues persists; retail showed FOMO behavior in small-ticket SME deals. This divergence signals institutional wariness despite market rally.
Kasturi Metal Composite, which listed on February 3, showed modest listing gains in the 5-8% range based on SME typical patterns[17]. No major mainboard listings this week; market attention focused on secondary market volatility.
Manufacturing and chemicals IPOs dominated February pipeline[16]. Tech IPOs underperformed in January; wait-and-see mode prevails given Nifty IT's -6.91% correction this week[16].
SME IPOs continue commanding premium valuations (P/E 25-35x) despite liquidity constraints. Mainboard pipeline hesitant post-January market correction—Aye Finance IPO, Fractal Analytics IPO await favorable windows[16].
Business: Biopol manufactures biodegradable polymer compounds for packaging, agriculture, and consumer goods—riding the sustainability wave.
Use of Proceeds: Expansion of manufacturing capacity (65%), working capital (25%), general corporate purposes (10%) — Green flag: Low OFS component.
Oorjita Verdict: Hold for listing pop; avoid long-term at current valuations. 29.63x subscription indicates frothy retail demand. Listing gain 10-20% likely, but fundamental P/E 30+ unsustainable given sector cyclicality. Better entry post-listing correction.
| IPO | Open Date | Size (₹ Cr) | Sector | Watch Factor |
|---|---|---|---|---|
| Biopol Chemicals | Feb 6-10 | - | Chemicals/SME | High subscription |
| Accretion Nutraveda | Early Feb | - | Nutra/SME | Wellness theme |
| CKK Retail Mart | Mid-Feb | - | Retail/SME | Regional play |
Table 12: Upcoming IPO Calendar - Next Week
Source Validation: SEBI DRHP filings + Chittorgarh + Motilal Oswal research[16][17][18] | Confidence: Medium — dates subject to change based on market conditions.
RBI's 7.4% GDP growth upgrade aligns with recent earnings surprises in domestic cyclicals:
The Convergence: Top-down confidence (RBI macro call) now matches bottom-up execution (corporate earnings). Sectors to watch: Infrastructure (government capex acceleration), domestic pharma (volume growth), and regional banks benefiting from credit growth (15.5% YoY as of Jan 2026).
INR appreciation of -1.61% this week creates immediate sector impacts:
Correlation Check: Nifty IT -6.91% vs Nifty Oil & Gas +0.51% this week—playbook executing as expected.
Historical Pattern: Weeks when both FII and DII are net buyers (like this one: +₹2,646 cr and +₹2,892 cr respectively[4]) see Nifty gains averaging 3-4%—this week's +3.50% fits the pattern perfectly.
Sustainability Test: Feb 13 monthly expiry rollover quality will determine if institutional conviction persists. Watch:
Based on earnings quality, working capital efficiency, institutional confidence, and management tone (NLP sentiment analysis):
Market DNA Insight: When defensive rotation coincides with rate-sensitive rally (as this week), it signals caution within optimism—institutions hedging macro uncertainty while chasing yields.
Confidence: Medium — Triangulated from sectoral index movements, FII net flow data, and delivery patterns[4].
Feb 13 (Thursday): Monthly F&O expiry Rollover quality crucial; watch 25,500 Put support and 26,000 Call resistance[15].
Feb 12-14: US CPI data, ECB meeting Global cues matter for FII flows; any hawkish surprise from Fed = EM equity risk.
Mid-Feb: Corporate earnings season tapers Focus shifts to Q4 guidance commentary; watch IT sector for FY27 outlook downgrades.
Breakout Trigger: Sustained close above 26,000 with volumes >70% of 20-day average (43.6 crore shares).
RBI's 7.4% GDP upgrade + rural demand recovery (monsoon carryover effect) benefits:
Kill-Switch: Crude above $85/bbl or global recession fears escalate (US hard landing scenario).
IT oversold; if dollar peaks (DXY 102-104 range holds) and US avoids hard landing, reversion trade active:
Kill-Switch: Fed maintains hawkish tone beyond March FOMC; INR sustains below 90.
Base Case (60% probability): Nifty consolidates 25,500-26,200; VIX stays <12; FII flows neutral to +₹500-1,000 cr weekly.
Bull Case (25% probability): Breakout above 26,341; targets 26,800 by month-end; FII inflows accelerate to +₹2,000+ cr weekly; IT sector stabilizes.
Bear Case (15% probability): Breakdown below 25,000; retest 24,570; FII outflows resume (-₹1,500+ cr); global risk-off (US recession fears).
Canary in Coal Mine: If VIX spikes >15 on no obvious news = institutional positioning for event risk.
Market breadth negative (1,779 decliners vs 1,340 advancers on Feb 6) despite index rally—suggests fragility. Only 43% of stocks participated in gains; 80+ stocks hit 52-week lows vs 29 hitting highs.
-6.91% drop amid earnings margin concerns; INR strength (-1.61%) creates persistent headwind. Q4 guidance risk into April earnings—potential for further downgrades.
Quality smallcaps lagging (+3.17% vs Nifty +3.50%) signals caution. Smallcap250 Quality 50 index down -0.68%—avoid junk; stick to governance-strong names with delivery >60%.
Nifty P/E at 22.26x vs long-term average 20.5x. Midcap/Smallcap P/E >30x—vulnerable to FII outflow shock. RBI growth upgrade (7.4%) provides cushion but margin of safety thin.
US Fed "higher for longer" rhetoric persists; dollar strength (if DXY >106) = EM equity risk. China property sector fragility unresolved—metals sector (+5.24% this week) rally could reverse.
Maximum Sector Exposure: 25% per sector (no concentration bets) Stop-Loss Discipline: 7-8% from entry for individual stocks; 5% for index positions Rebalance Trigger: If any position >12% of portfolio, trim to 8-10%
Week 6 of 2026 delivered a textbook V-shaped recovery—Nifty +3.50% (868 points),
capitulation at 24,571.75 gave way to Tuesday's explosive gap-up (26,341.20 high), followed by disciplined consolidation through week-end.
RBI's growth upgrade (7.4%) and inflation comfort (2.1%)[13] provided the macro scaffold, while
confirmed institutional conviction.
Yet, caution persists beneath the surface: IT sector carnage (-6.91%), negative breadth (1,779 decliners vs 1,340 advancers), and 80 stocks hitting 52-week lows signal narrow leadership. The rally is real but fragile—quality over quantity remains the winning formula.
Next week's F&O expiry (Feb 13), US CPI data, and IT sector guidance will test the rally's
OI)—bullish setup but needs volume confirmation above 26,000[15].
Oorjita's Take: Bullish above 25,500; selective accumulation in domestic cyclicals (auto, FMCG, regional banks) and quality financials. Avoid IT until dollar stabilizes (DXY <104) or valuations compress further (P/E <25x). Stay nimble—this market rewards speed, not stubbornness.
This newsletter is for informational and educational purposes only and does not constitute investment advice, financial advice, trading advice, or any other sort of advice. The content is provided "as is" without warranty of any kind.
Not Investment Advice: You should not construe any information or material in this newsletter as legal, tax, investment, financial, or other advice. Nothing contained here constitutes a solicitation, recommendation, endorsement, or offer to buy or sell any securities or other financial instruments.
Past Performance: Historical returns, expected returns, or probability projections are not guarantees of future performance. The value of investments can go down as well as up, and you may not get back the full amount invested.
Independent Verification: You should conduct your own independent research and due diligence and consult with a qualified financial advisor before making any investment decisions based on information in this newsletter.
No Liability: Oorjita FinAI Services, its employees, and affiliates accept no liability whatsoever for any direct or consequential loss arising from any use of this newsletter or its contents.
Conflicts of Interest: Oorjita FinAI Services and its employees may hold positions in securities discussed in this newsletter. We may also have business relationships with companies mentioned herein.
Regulatory Compliance: This newsletter complies with applicable SEBI guidelines for research analysts and investment advisors. Registration details available on request.
Data Accuracy: While we strive for accuracy, errors may occur. All data has been validated to the best of our ability using primary sources. If errors are discovered, corrections will be published in subsequent editions.
Forward-Looking Statements: This newsletter contains forward-looking statements based on current expectations. Actual results may differ materially. We undertake no obligation to update these statements.
Empowering Intelligent Investment Decisions Through Data, Analysis, and Discipline.
Contact: insights@oorjita.com | www.oorjita.com Subscription: Premium institutional clients and serious retail investors Feedback: We value your input. Email research@oorjita.com
Website: oorjita.ai
Location: Bengaluru, Karnataka, India
Contact: insights@oorjita.ai
www.oorjita.ai is not operated by a broker, a dealer, or a registered investment adviser. Under no circumstances does any information posted on www.oorjita.ai represent a recommendation to buy or sell a security. The information on this site, and in its related newsletters, is not intended to be, nor does it constitute investment advice or recommendations. The information on this site is in no way guaranteed for completeness, accuracy or in any other way. In no event shall Oorjita Fin AI Services be liable to any member, guest or third party for any damages of any kind arising out of the use of any content or other material published or available on www.oorjita.ai, or relating to the use of, or inability to use, www.oorjita.ai or any content, including, without limitation, any investment losses, lost profits, lost opportunity, special, incidental, indirect, consequential or punitive damages. Past performance is a poor indicator of future performance.
Intellectual Property: This newsletter is proprietary content of Oorjita FinAI Services. Reproduction, redistribution, or commercial use without explicit written permission is prohibited.
Prepared by: Oorjita FinAI Research Team Contact: : insights@oorjita.ai| www.oorjita.ai
