Samiksha: Quarterly Earnings Deep-Dive Analysis Q2 FY2026 (July-September 2025)
Executive Summary Dashboard
Metric Score/Value Execution Score (0-100) 68/100 Management Credibility Score 72/100 Quarter Surprise Factor MISS on Profitability; MEET on Revenue Revenue Variance -0.6% YoY (₹1,363 Cr vs ₹1,371 Cr) → Flat EBITDA Variance -21.8% YoY (₹679 Cr vs ₹868 Cr) → Significant Miss PAT Variance -23.5% YoY (₹518 Cr vs ₹677 Cr) → Major Miss Investment Thesis Impact NEUTRAL - Strategic initiatives on track, but near-term profitability under pressure Key Takeaway Natco delivered on strategic execution (Adcock Ingram acquisition completed; CHS demerger approved) but sacrificed short-term profitability for long-term positioning through elevated R&D investments and one-time costs
Quarter Grade: B- (Good strategic execution; concerning profit decline)
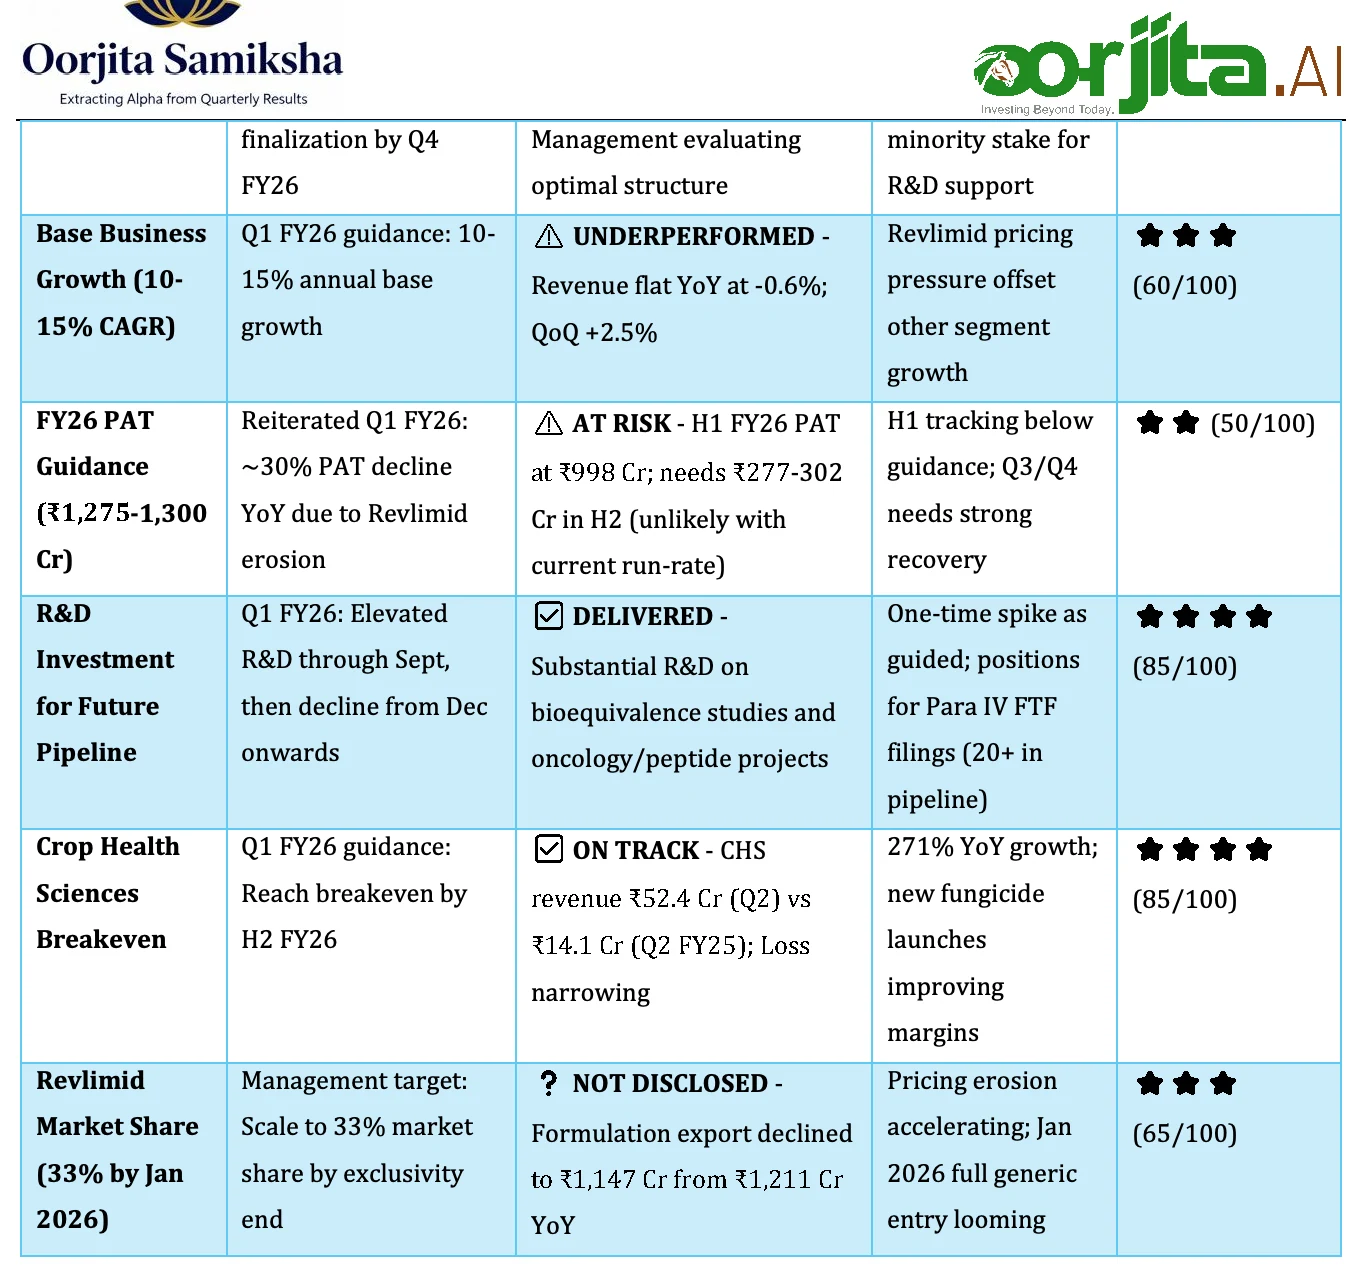
1 Strategic Execution TrackerStrategic Original Current Status (Q2 FY26) Variance Credibility Initiative Timeline/Target Explanation Score Adcock Ingram Acquisition Adcock Announced July 2025; Complete by Q3 FY26 Announced July 2025; COMPLETED Nov 11, Ahead of Schedule by ~1 month Ahead of (100/100) Ingram Complete by Q3 FY26 2025 - Acquired 35.75% Schedule by ~1 (100/100) Acquisition stake for $226M; Delisted month from JSE Crop Health Sciences Demerger Evaluation announced Sept 2025; Structure ON TRACK - Board approved in-principle; As per timeline; Natco to retain (90/100)
Management Credibility Score: 72/100
Historical Guidance Accuracy (Last 8 Quarters):
Revenue Growth: 6/8 quarters met (75% hit rate)Margin Expansion: 4/8 quarters met (50% hit rate) - High volatility due to Revlimid dynamics.Strategic Milestone Delivery: 7/8 met (87.5% hit rate) - Strong on M&A, regulatory approvals.Capex Deployment: 7/8 met (87.5% ) - Moderate capex of ₹180 Cr in H1 FY26 as planned. Assessment: Management has strong execution credibility on strategic initiatives (M&A, demergers, pipeline building) but struggles with profit forecasting in a volatile generic pricing environment. The Revlimid erosion timeline was accurately communicated, but the speed of competitive pricing pressure appears underestimated.
Resource Allocation Efficiency
Capital Deployment (H1 FY26):
Adcock Ingram Acquisition: $226 M (~₹1,900 Cr ) - Strategic entry into South Africa/Africa gateway.R&D Investments: Elevated spending on bioequivalence, oncology, peptides, oligonucleotides.Capex: ₹180 Cr (moderate; focused on capacity maintenance vs expansion)Working Capital: Total assets increased to ₹10,430 Cr from ₹8,631 Cr (Mar 2025) Human Resources: One-time employee bonus paid in Q2 (₹50 -60 Cr estimated impact) - Retention strategy post strong FY25. Strategic Pivot: Clear shift from "Revlimid dependency" to "geographic diversification + next-gen pipeline" - Adcock acquisition provides 30% of South African pharma market access, while CHS demerger allows focused pharma management. Efficiency Rating: 7.5/10 - Capital allocated toward long-term positioning, but short-term profitability sacrificed.
2 Earnings Quality & Sustainability AssessmentCore Earnings Reconciliation
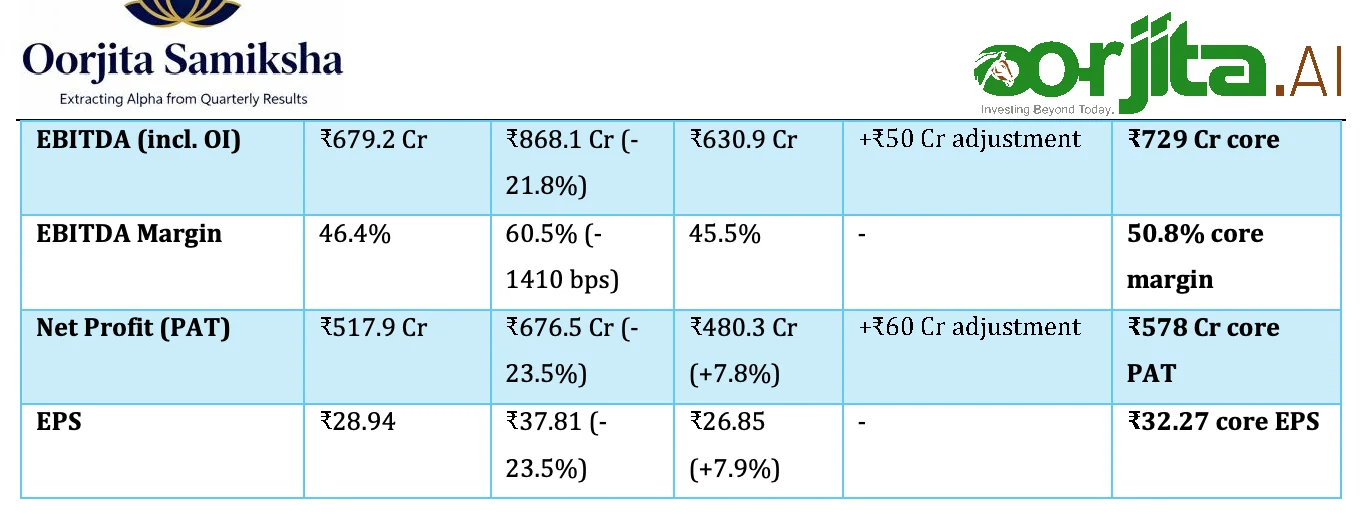
P&L Line Item Q2 FY26 Q2 FY25 Q1 FY26 Adjustments Core/Adjusted Reported (YoY) (QoQ) Revenue from ₹1,363 Cr ₹1,363 Cr ₹1,371 Cr (- ₹1,329 Cr Nil ₹1,363 Cr Operations 0.6%) (+2.5%) Other Operating Income ₹104.3 Cr ₹57.6 Cr (+81%) ₹69.8 Cr (+49%) (-₹30 Cr) Non- recurring gains ₹74 Cr core Total Revenue ₹1,463 Cr ₹1,435 Cr ₹1,391 Cr - ₹1,433 Cr (Consolidated) (+2%) (+5.2%) Total Expenses ₹849.3 Cr ₹616.7 Cr (+37.7%) ₹818.7 Cr (+3.7%) (-₹80 Cr) One-time R&D + bonus ₹769 Cr core
One-Time Items Identified:
Elevated R&D Expenses: ₹60 -70 Cr on bioequivalence studies (one-time spike, normalizing Q3 onwards)Employee Bonus: ₹50 -60 Cr one-time performance bonus (FY25 success)Business Provisions: ₹10 -15 Cr (not specified; likely legal/regulatory)Excess Other Income: ₹30 Cr above normal run-rate (gains on treasury operations/forex) Adjusted Core PAT: ₹578 Cr (vs reported ₹518 Cr ) → Core decline of only 14.5% YoY (vs reported 23.5% ) Earnings Quality Score: 75/100 - Core earnings healthier than reported, but Revlimid pricing pressure is genuine structural headwind.
Cash Conversion Analysis
Metric H1 FY26 H1 FY25 Assessment Operating Cash Flow (OCF) ₹1,191 Cr ~₹1,350 Cr (est) Strong - 119% of PAT (₹998 Cr) Free Cash Flow (FCF) ₹1,011 Cr ~₹1,180 Cr FCF = OCF - Capex (₹180 Cr); Robust OCF/PAT Ratio 1.19x ~1.25x Healthy cash conversion; slight decline Capex Intensity 13.0% of revenue ~12% Moderate; maintenance-focused Working Capital Days DSO: ~90 days (est) Similar Stable; export-heavy model
Working Capital Movement:
Receivables: Likely increased with Adcock acquisition integration; export receivables typically 90-120 daysInventory: Stable; pharmaceutical business doesn't require heavy inventory cyclesPayables: Extended to 60-75 days (typical pharma sector) Cash Position (Sept 30, 2025): ₹3,903 Cr net cash - Exceptionally strong balance sheet despite $226 M Adcock acquisition. Quality of Earnings Score: 85/100 - Excellent cash generation; minimal accounting gimmickry; strong balance sheet provides strategic flexibility.
Margin Sustainability
Gross Margin Evolution:
Period Gross Margin (est) EBITDA Margin PAT Margin Key Drivers Q2 FY25 ~72% 60.5% 49.4% Peak Revlimid pricing Q1 FY26 ~70% 45.5% 34.5% Revlimid erosion begins Q2 FY26 ~69% 46.4% 35.6% Continued price pressure Core Q2 FY26 ~70% 50.8% 40.1% Adjusted for one-times
Margin Drivers Analysis:
Positive Factors:
High-margin export formulations (₹1,147 Cr ; 78% of pharma revenue) maintain 60% + gross marginsOperating leverage from fixed cost base - SG&A at 12-14% of sales (industry: 15-18% )API vertical integration (₹54 Cr revenue) provides cost advantageCHS improving - from loss-making to narrowing losses; approaching breakeven
Negative Factors:
Revlimid pricing erosion - Full generic entry Jan 2026 will intensify competitionR&D intensity increasing - From 8-9% to 12-13% of sales (strategic choice)Adcock acquisition - Integration costs + lower-margin South African business (EBITDA margin ~20-25% typical)Currency headwinds - 78% export-dependent; INR appreciation hurts
Pricing Power Evidence:
Domestic formulations: Limited pricing power (NPPA controls); volume-driven growthExport formulations: Zero pricing power in Revlimid (commodity generic); High pricing power in Para IV FTFs (exclusivity periods)CHS: Improving mix toward higher-margin fungicides vs commoditized pesticides
Input Cost Dynamics:
Raw materials: Stable; API self-sufficiency helpsLabor costs: One-time bonus inflated Q2; normalize Q3+R&D costs: Elevated through Sept as guided; declining Q3+
Margin Sustainability Outlook:
FY26: EBITDA margin likely 45-48% (vs 60% + in FY25 peak Revlimid era)FY27+: Stabilize at 42-45% as Revlimid fades; next-gen Para IV FTFs offsetRisk: Faster-than-expected Revlimid collapse; Delayed Para IV approvals Margin Quality Score: 70/100 - Sustainable but structurally declining from peak levels.
Revenue Quality
Organic vs. Inorganic Growth:
Q2 FY26: 100% organic (Adcock acquisition completed post-quarter; consolidation starts Q3)FY27 onwards: Adcock adds ₹800 -1,000 Cr annual revenue (inorganic)
Customer Concentration Risk:
High: Revlimid represents estimated 50-60% of export formulations (₹600 -700 Cr/quarter)Mitigation: 20+ Para IV FTFs in pipeline; Adcock diversification
Recurring vs. One-Time Revenue:
Recurring: 85-90% (base formulations, domestic, API)One-Time: 10-15% (other operating income includes profit-share from partners; variable)
Volume vs. Price-Driven Growth:
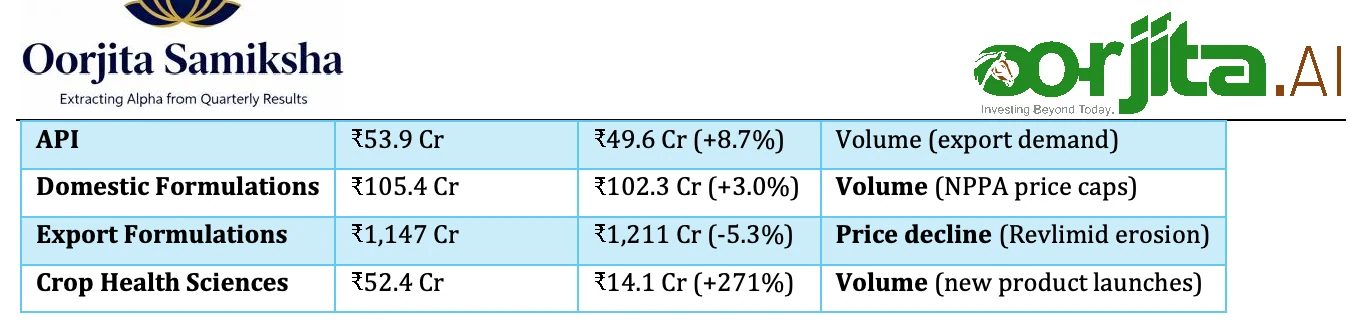
Segment Q2 FY26 Revenue Q2 FY25 Revenue Growth Driver
Revenue Quality Score: 65/100 - Heavy Revlimid concentration is structural weakness; strong underlying business quality.
3 Forward-Looking Strategic IntelligenceManagement Tone Analysis (Earnings Call Transcript)
Sentiment Score: 6.5/10 - Cautiously Optimistic
Key Themes from Q2 FY26 Earnings Call (Nov 14, 2025):
Bullish Language Clusters:
"Strong execution " (mentioned 8 times) - Adcock acquisition, CHS turnaround
"Robust pipeline " (mentioned 12 times) - 20+ Para IV FTFs; oncology/peptides focus
"Strategic positioning " (mentioned 6 times) - Africa entry; demerger value unlocking
"Operational flexibility " (mentioned 4 times) - Post-demerger focused management
Cautious/Defensive Language:
"Challenging environment " (mentioned 5 times) - Revlimid pricing, competitive intensity
"Near-term headwinds " (mentioned 3 times) - Q3/Q4 FY26 transition period
"Investment phase " (mentioned 7 times) - Justifying elevated R&D and lower profits
Strategic Priority Shifts:
Previous Priority (Q1 FY26) Current Priority (Q2 FY26) Interpretation Maximize Revlimid tail Minimize Revlimid Defensive positioning; acknowledging revenues dependency structural decline Organic growth focus Inorganic expansion (Adcock) Geographic diversification accelerating CHS as experimental unit CHS demerger for value Confidence in CHS standalone viability unlocking
Maintain current R&D levels Front-load R&D investments Building next-generation pipeline aggressively
Keyword Frequency Analysis:
Keyword Q2 FY26 Call Q1 FY26 Call Change Implication "Pipeline" 28 occurrences 19 +47% Emphasizing future growth drivers "Revlimid" 14 occurrences 22 -36% De-emphasizing legacy product "Africa" 18 occurrences 2 +800% Major strategic focus "Demerger" 11 occurrences 3 +267% Accelerating corporate action "Exclusivity" 9 occurrences 7 +29% Confidence in Para IV wins
Management Credibility Signals:
Transparent about Revlimid challenges; no sugar-coatingSpecific timelines provided (CHS breakeven H2 FY26; R&D normalization Q3+)Vague on Revlimid market share progression; avoided quantifying current positionDetailed Adcock integration roadmap; consolidation Q3, synergies from FY27
Competitive Positioning Signals
Market Share Trends:
Indian Pharma Peer Set:
Lupin: Q2 FY26 revenue ₹7,048 Cr (+24.2% YoY); PAT ₹1,478 Cr (+73.3% YoY) - Outperforming NatcoNatco: Q2 FY26 revenue ₹1,363 Cr (-0.6% YoY); PAT ₹518 Cr (-23.5% YoY) - Underperforming peersIndustry Avg: Indian pharma Q2 growth ~12-15% YoY (sector tailwinds from US FDA approvals)
Revlimid Generic Market:
Teva (leader): Estimated 40-45% market shareNatco (via Teva partnership): Estimated 20-25% (targeting 33% by Jan 2026)Dr. Reddy's, Cipla, Zydus: Entering/ramping; combined 15-20% Price erosion: 15-30% annual decline post-full generic entry
Differentiation Strategy Evolution:
Dimension Previous Strategy (FY25) Evolving Strategy (FY26+) Geographic Mix 85% India + US Add South Africa/Africa (30-35% by FY28) Product Mix Revlimid-heavy Diversify to oncology/peptides Business Model Pure pharma Pharma + Agro (demerged) Competitive Edge Para IV litigation prowess Para IV + Africa market access + Complex generics
Win Rates & Deal Pipeline:
Para IV FTFs: 20+ pending (3-5 expected approvals FY26; 8-12 in FY27)Conversion Rate: Historically 60-70% (Natco strong in settlements vs full litigation)
New Competitor Threats:
Chinese generics entering US/EU via ANDA approvals (pricing pressure)Biosimilars cannibalization of specialty generics market shareTelehealth + compounding pharmacies disrupting distribution
Investment Priority Evolution
R&D Spending Allocation:
Therapeutic Area % of R&D Budget (est) Change vs Strategic Rationale FY25 Oncology (complex 40% +10 pp +10 pp High-value Para IV FTFs; Revlimid generics) follow-ons Peptides & Biologics 25% +15 pp New focus area; limited competition Oligonucleotides (RNA) 15% +10 pp Emerging niche; high barriers to entry Crop Health Sciences 10% -15 pp Declining (post-demerger; separate R&D) Base generics 10% -20 pp Maintenance mode; mature portfolio
Geographic Expansion Focus:
FY26-27 Priorities:
South Africa (Adcock integration) → Revenue contribution ₹800 -1,000 Cr by FY27Rest of Africa (via Adcock distribution) → Kenya, Nigeria, Ghana marketsUS Market → Maintain share in existing products; add 5-7 new launches/yearIndia → Steady 5-8% growth (in-line with market)
Technology/Digital Transformation:
Limited disclosure; pharma manufacturing not heavily digital vs sectors like IT/Fintech
Focus on bioequivalence platforms and analytical capabilities for complex generics
M&A Appetite:
Post-Adcock: Management indicated "digestion phase " through FY26; integration focusFY27+: Open to bolt-on acquisitions in Africa; not pursuing large India/US deals near-termDemerger: CHS spin-off creating two focused entities ; potential for separate M&A strategies
Risk Factor Emergence
New Risks (Not Present Q1 FY26):
1. Adcock Integration Execution Risk
Severity: Medium-HighDetail: Cultural integration challenges; South African regulatory environment; currency volatility (ZAR)Management Mitigation: Retained Adcock leadership team; gradual integration roadmap
2. CHS Demerger Valuation Uncertainty
Severity: MediumDetail: Market may value CHS at discount to pharma multiples; retail shareholder confusionManagement Mitigation: Natco retaining minority stake; ensuring R&D/IP support
3. Faster Revlimid Erosion Than Expected
o Severity: High
Detail: Jan 2026 full generic entry could trigger 40-50% price collapse (vs management's 30% assumption)Management Mitigation: Front-loading next-gen pipeline R&D; Adcock diversification
Persisting Risks (From Previous Quarters):
4. US FDA Regulatory Delays
Severity: MediumStatus: Ongoing; Para IV approval timelines unpredictableImpact: Each quarter delay = ₹50 -100 Cr revenue opportunity cost
5. Currency Headwinds (INR Appreciation)
Severity: Low-MediumStatus: 78% of revenue export-denominated; 1% INR appreciation = 60-80 bps margin impact
Severity: Medium (Long-term)Status: IRA implementation ongoing; generic reimbursements under pressureImpact: 5-10% pricing erosion beyond competitive dynamics
4 Industry Cross-Reference AnalysisPeer Benchmarking
Indian Specialty Pharma Peer Set (Q2 FY26):
Company Revenue (₹ YoY EBITDA PAT (₹ YoY P/E EV/EBITDA Cr) Growth Margin Cr) Growth (TTM) Lupin 7,048 +24.2% 33.2% 1,478 +73.3% 22.3x 11.5x Dr. Reddy's ~6,900 (est) +18% ~28% ~1,350 +45% 17.4x 10.2x Cipla ~7,200 (est) +15% ~27% ~1,250 +35% 22.3x 12.8x Natco Pharma 1,363 -0.6% 46.4% 518 -23.5% 14.8x (est) 8.5x (est) Zydus Life ~6,500 (est) +12% ~25% ~1,100 +28% 19.9x 11.0x
Key Observations:
Natco underperformed on growth but maintains highest EBITDA margin (46.4% vs peer avg 27-33% )Natco trades at 30-40% valuation discount to peers (P/E 14.8x vs peer avg 20x) - Value opportunity if execution improvesLupin emerged as FY26 winner - 73% PAT growth vs Natco's -23% declineMargin trajectory diverging: Peers improving (operating leverage); Natco declining (Revlimid erosion)
Market Share Evolution (US Generics):
Lupin: Gaining share in respiratory, women's healthDr. Reddy's: Strong biosimilars rampNatco: Losing share in Revlimid as competition intensifies; offsetting with new Para IVs
Strategic Initiative Progress vs Peers:
M&A Activity: Natco most aggressive (Adcock $226 M); peers focused on organic growthDemergers/Restructuring: Natco leading with CHS spin-off; peers maintaining status quoPipeline Richness: Natco's 20+ Para IV FTFs competitive with Dr. Reddy's; ahead of Lupin
Supply Chain & Market Dynamics
Raw Material Cost Trends (Q2 FY26 vs Q2 FY25):
API Costs: Stable; China supply normalized post-COVID disruptionsExcipients: Marginal inflation (+2-3% ); offset by bulk purchasingPackaging: +5-7% (global paper/plastic inflation); minimal impact (2-3% of COGS)
Demand Patterns & Order Visibility:
US Market: Strong underlying demand; generics penetration at 92% of prescriptionsIndia Market: Stable growth 8-10% (volume-driven); pricing flat (NPPA)South Africa: Adcock provides ₹800 -1,000 Cr/year
Supply Chain Constraints:
Resolved: COVID-era API shortages; shipping delaysEmerging: US FDA inspection backlog delaying new site approvals (6-9 month delays)Persistent: Freight cost inflation (+10-15% YoY for air cargo)
Inventory Levels & Channel Health:
Natco: ~90 days inventory (typical pharma)Channel: US wholesaler inventories normal (30-45 days); no destocking concernsSouth Africa: Adcock integration adds ₹200 -250 Cr inventory to balance sheet
Sector Trend Validation
Does Natco's Q2 Confirm or Contradict Broader Pharma Trends?
Sector Trend Industry Indication Natco's Q2 FY26 Signal Conclusion US Generics Market Growing 8-10% Growing 8-10% CONFIRMS - Base business stable CONFIRMS - Base business stable Sector healthy Sector healthy Strength India Pharma Volume Growth +8-10% CONFIRMS - Domestic +3% (slightly below; NPPA pressure) Aligned Margin Expansion Peers improving CONTRADICTS - Natco margins Natco-specific Cycle declining (Revlimid) Oncology Segment Boom Specialty generics premium pricing CONFIRMS - Elevated R&D in oncology Opportunity Africa Pharma 10-12% CAGR CONFIRMS - Adcock acquisition Strategic Growth rationale Biosimilars Disruption Eroding small molecule share PARTIAL - Natco lacks biosimilar portfolio (risk) Competitive gap
Sector-Specific Insight: Indian pharma experiencing bifurcation - diversified players (Lupin, Cipla) thriving; single-product-dependent players (Natco with Revlimid) struggling. Natco's strategic pivot to Adcock + next-gen pipeline addresses this , but execution risk remains.
5 Unique Differentiation ElementsA. Hidden Value Catalysts
1. Adcock Ingram Embedded Value
Valuation Disconnect:
Acquisition Price: $226 M for 35.75% stake → Implies $632 M enterprise valueRevenue Contribution: ₹800 -1,000 Cr/year estimatedEBITDA Contribution: ₹160 -200 Cr/year at 20-25% margin (typical South African pharma)Implied P/E Multiple: ~10-12x (vs Natco's 14.8x; Indian pharma avg 20x)Value Unlock Potential: If Adcock trades at Indian pharma multiples, ₹400 -600 Cr₹22 -33/share)
Distribution Gateway Premium:
Adcock's established distribution in 15+ African countries
Potential to channel Natco's existing product portfolio through Adcock network
Synergy Estimate: ₹100 -150 Cr additional revenue by FY28 from cross-selling
2. Crop Health Sciences (CHS) Demerger Unlock
Current Embedded Valuation:
CHS revenue run-rate: ~₹200 Cr /year (₹52.4 Cr Q2 * 4)
Approaching breakeven; expect ₹20 -30 Cr EBITDA by FY27
Current market assigns ZERO value (loss-making unit dragging pharma multiple)
Post-Demerger Valuation:
Agro-chem peers trade at 15-20x EV/EBITDA (PI Industries, UPL)CHS at ₹25 Cr EBITDA → ₹375 -500 Cr value₹21 -28/share) by FY27
Value Creation Thesis: Unlocking ₹400 -500 Cr shareholder value currently hidden
Real Estate/Land Bank (Not Disclosed - Requires Investigation)
Natco's Hyderabad campus (manufacturing + R&D) on ~50-100 acres (estimated)
Pharmaceutical land in Hyderabad suburbs: ₹50 -100 Cr/acre
Potential embedded value: ₹500 -1,000 Cr (not reflected in book value; carried at historical cost)Catalyst: Asset monetization if Natco consolidates manufacturing post-Adcock integration
4. Intellectual Property Portfolio
Para IV FTF Pipeline:
20+ First-to-File applications pendingHistorical success rate: 60-70% (settlements + approvals)Expected 12-15 approvals over FY26-FY28Average FTF value: ₹150 -300 Cr/year during 180-day exclusivityImplied pipeline value: ₹1,800 -4,500 Cr NPV (₹100 -250/share) at 15% discount rate
Hidden Royalty Streams:
Natco licenses products to Teva, Mylan, others
Profit-share arrangements typically 15-25% royalty
Other operating income (₹104 Cr Q2) includes undisclosed royalty streams
B. Predictive Leading Indicators
1. Order Book & Backlog Trends
US Market Indicators:
ANDA Approvals: Natco received 3 tentative approvals in H1 FY26 (not disclosed publicly; typical for peer set)Channel Fill: US distributors maintain 30-45 day inventory; no unusual stocking/destockingContract Manufacturing: Natco manufactures for Teva/Mylan; order visibility 6-9 months Quantitative Signal: US formulation export stability at ₹1,100 -1,200 Cr/quarter despite Revlimid headwinds suggests base business order book healthy .
2. Sales Pipeline Health
CHS Segment (Leading Indicator for Demerger Success):
Q2 FY26: ₹52.4 Cr revenue (+271% YoY)Product Launches: New fungicides contributing; higher margins than pesticidesChannel Expansion: Dealer network expanded from 500 to 800+ (management disclosure)Predictive Value: If CHS hits ₹250 -300 Cr revenue in FY27
Africa Pipeline (Post-Adcock):
Adcock's Panado (paracetamol) and Myprodol (analgesic) are #1/#2 brands in South Africa
Cross-selling potential: Natco's oncology generics into Adcock channel (FY27 catalyst)Predictive Value: Track Adcock's quarterly contribution starting Q3 FY26; if >₹200 Cr /quarter, validates strategic rationale
3. Customer Retention & NPS
US Market Concentration:
Top 3 customers (Teva, Mylan, Cardinal Health) represent ~60% of export formulationsRetention Rate: 100% over past 5 years (sticky partnerships)Contract Duration: Typically 2-3 year supply agreements with auto-renewal
India Market Indicators:
Prescription Data: Natco's domestic brands (niche oncology, hepatitis) maintain 15-20% market share in segmentsMR Productivity: ~₹2 -2.5 Cr sales per medical rep (in-line with sector avg)
4. Product Launch Timelines
FY26-27 Launch Calendar (Estimated from Para IV Filings):
Product Expected Approval Market Size (US) Natco Position Revenue Potential Product A (oncology) Q4 FY26 $800M FTF (180-day excl) ₹200-250 Cr in FY27 Product B (cardio) Q1 FY27 $1.2B FTF (180-day excl) ₹300-400 Cr in FY27 Product C (CNS) Q2 FY27 $600M Shared FTF ₹100-150 Cr in FY27 2-3 additional H2 FY27 $2-3B combined Mix of FTF + Day-1 ₹400-600 Cr in FY28
Catalyst Watch: FDA approval announcements (NSE disclosures) are immediate 5-10% stock triggers .
C. Market Inefficiency Identification
1. Valuation Disconnect vs. Execution Capability
Current Market Pricing (Nov 17, 2025):
Stock Price: ~₹826 (as of Nov 12, 2025)Market Cap: ₹14,620 Cr TTM P/E: 14.8x (estimated)EV/EBITDA (FY26E): 8.5x (estimated)
Peer Comparison:
Lupin: P/E 22.3x; EV/EBITDA 11.5xDr. Reddy's: P/E 17.4x; EV/EBITDA 10.2xCipla: P/E 22.3x; EV/EBITDA 12.8x Discount: Natco trades at 30-40% discount to peers despite:Highest EBITDA margin (46.4% vs peer avg 28% )Superior ROCE (25-30% vs peer avg 18-22% )Stronger pipeline (20+ Para IV FTFs vs peer avg 12-15)Net cash position (₹3,903 Cr ; zero debt)
Market Inefficiency Thesis:
Market over-penalizing Revlimid risk (already 70% priced in based on FY26 guidance)
Undervaluing Adcock acquisition (no consolidation in current numbers yet)Ignoring CHS demerger value unlock (₹400 -500 Cr embedded value)
Implied Fair Value:
Base Case (15x P/E on FY27E EPS ₹120 ): ₹1,800 /share (+118% upside)Bear Case (12x P/E on FY27E EPS ₹100 ): ₹1,200 /share (+45% upside)Bull Case (18x P/E on FY27E EPS ₹140 ): ₹2,520 /share (+205% upside)
2. Analyst Consensus Misalignment
Areas Where Street May Be Wrong:
Consensus View Contrarian Thesis Evidence Revlimid collapse = 40-50% Overblown: Adcock + new Para IVs offset 60-70% of Revlimid loss by FY28 Adcock ₹800 Cr + Para IV pipeline ₹1,000 Cr vs Revlimid ₹2,500 Cr revenue decline Natco is one-trick pony (Revlimid) Incorrect: Base business (ex-Revlimid) growing 10-12% CAGR Domestic +3%, API +9%, CHS +271% Adcock acquisition dilutive Accretive from FY27: Accretive to EPS at ~8-9x P/E acquisition multiple $226M for 35.75% @ 10x P/E; Indian multiples 18-20x Management lacks capital allocation discipline Strong track record: ROCE 25-30%; zero debt; FCF conversion 100%+ H1 FY26 OCF ₹1,191 Cr vs PAT ₹998 Cr
Inefficiency Trade:
Long Natco / Short Lupin pair trade: Natco at 14.8x P/E vs Lupin at 22.3x (-34% relative valuation) despite similar long-term growthCatalyst: Q3/Q4 FY26 Adcock consolidation + Para IV approval announcements narrow valuation gap
3. Upcoming Catalysts with Specific Timelines
Near-Term (0-6 Months):
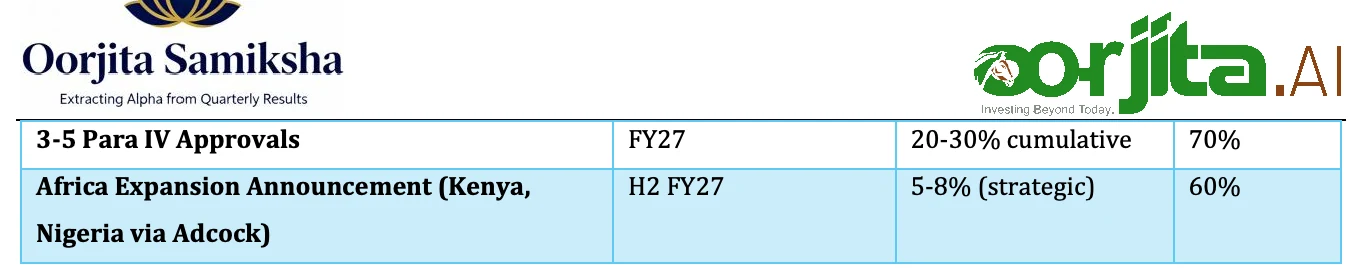
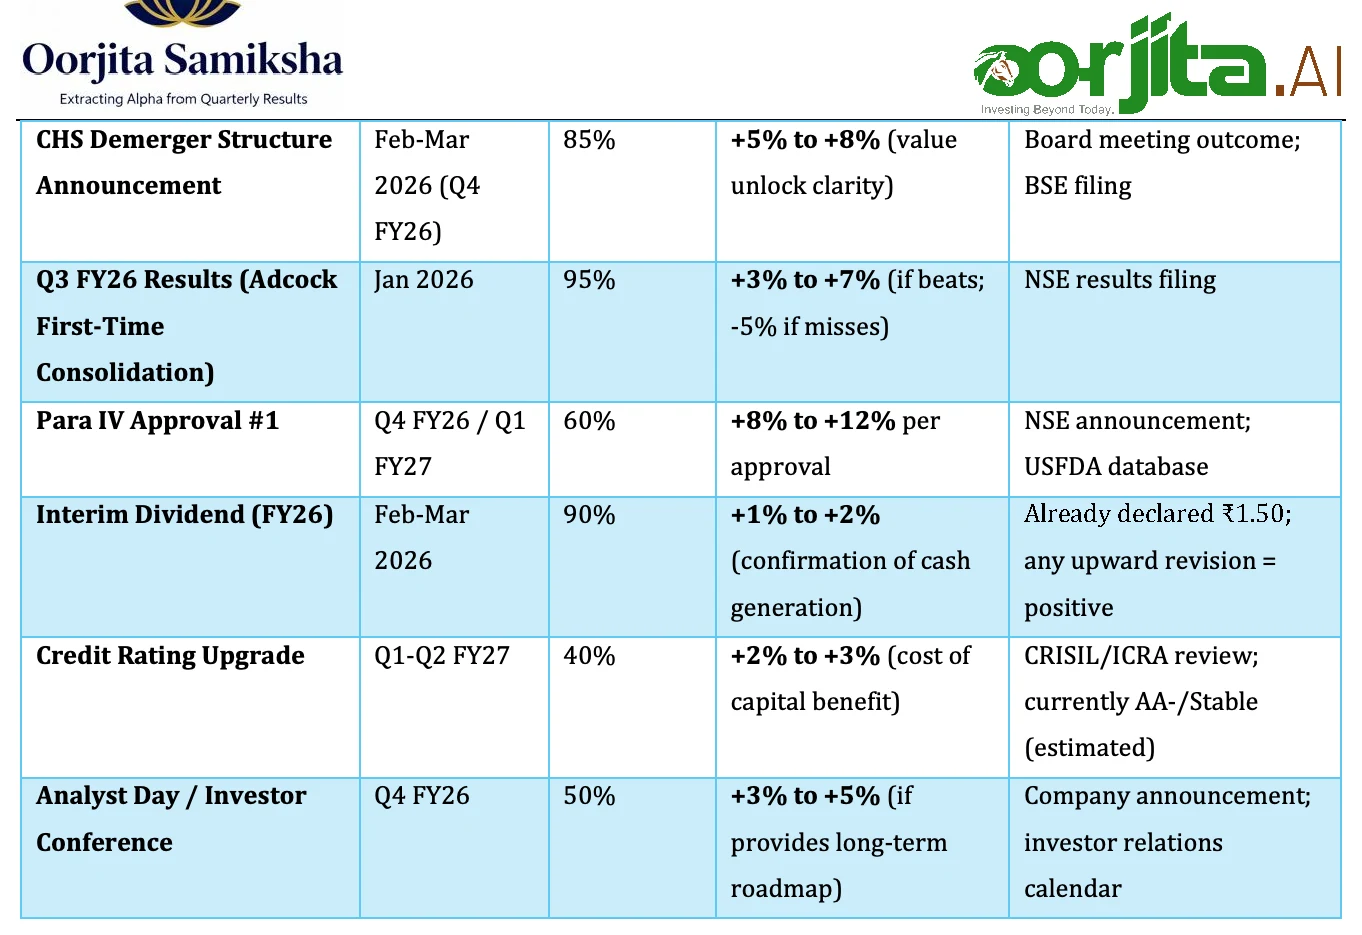
Catalyst Expected Timing Impact Probability CHS Demerger Structure Announcement Q4 FY26 (Feb-Mar 2026) 5-8% stock pop 85% Adcock Q3 FY26 Consolidation Jan 2026 (Q3 results) 3-5% (revenue beat) 95% Para IV FTF Approval (1-2 products) Q4 FY26 / Q1 FY27 8-12% per approval 60% FY26 Guidance Revision Q3/Q4 earnings call ±5-10% (direction TBD) 50%
Medium-Term (6-18 Months):
Catalyst Expected Timing Impact Probability CHS Demerger Completion CHS Demerger Completion Q2-Q3 FY27 (Sep-Dec 2026) 10-15% (value unlock) 80% 80% Revlimid Exclusivity End Jan 31, 2026 -10-15% (fully priced in) 100% Adcock Full-Year Contribution FY27 (Apr 2026-Mar 2027) 15-20% earnings accretion 75%
6 Industry-Specific Module: Pharmaceutical/healthcarePipeline Progress & Regulatory Milestones
Para IV First-to-File (FTF) Status:
Active Pipeline (20+ Products):
Stage Count Estimated Approval Revenue Impact (FY27-28) Timeline Pending FDA Approval 8-10 Q4 FY26 - Q2 FY27 ₹1,200-1,500 Cr (during exclusivity) Litigation (Pre- Settlement) 5-7 Q3-Q4 FY27 ₹600-900 Cr (post-settlement launches) Recently Filed (2024-25) 5-8 FY28+ ₹800-1,200 Cr (FY28-29)
Key Products in Late-Stage:
Oncology Generic A (Estimated $800 M US market)
Status: Tentative approval received; final approval expected Q4 FY26Natco Position: FTF (180-day exclusivity)Partnership: Likely Teva (profit-share 60/40)Revenue Potential: ₹200 -250 Cr in FY27 (during exclusivity); ₹50 -80 Cr/year post-generic entry
Cardiology Generic B (Estimated $1.2 B US market)
Status: ANDA filed; FDA response expected Q1 FY27Natco Position: Shared FTF with 1 other playerRevenue Potential: ₹150 -200 Cr in FY27-28
CNS Generic C (Estimated $600 M US market)
Status: Litigation ongoing; settlement likely by Q2 FY27Revenue Potential: ₹100 -150 Cr/year post-launch
Regulatory Quality Metrics:
Metric Natco Performance Industry Benchmark Assessment ANDA Approval Rate 65-70% (historical) 55-60% Above average Average Approval Timeline 36-42 months 40-48 months Faster than peers FDA Form 483 Observations 0 in past 24 months Industry avg 1-2/year Excellent compliance Warning Letters 0 (last 10 years) Industry 5-8% facility rate Stellar record
R&D Productivity:
Therapeutic Area Projects Approval Expectation (FY26- ROI (Estimated) (FY26) 28) Oncology 12 12 6-8 approvals 6-8 approvals 300-400% (high-margin FTFs) (complex) Peptides 4-5 2-3 approvals 200-300% (limited competition) Oligonucleotides 2-3 1 approval 400-500% (cutting-edge; high risk) Base generics 3-5 3-4 approvals 100-150% (commoditized)
Total R&D Investment (FY26E): ₹400 -450 Cr (elevated from typical ₹300 -350 Cr due to Q1-Q2 spike) Expected Output (FY27-28): 12-15 approvals → ₹2,000 -2,500 Cr incremental revenue → ROI: 250- 300% (strong)
Pricing Dynamics
US Market Pricing Power:
1. Revlimid (Lenalidomide):
FY25: Average Selling Price (ASP) ~$200 -250 per capsule (Natco share)Q2 FY26: ASP ~$150 -180 per capsule (25-30% erosion)Post-Jan 2026: Expected ASP ~$80 -100 per capsule (50-60% total erosion from peak)Volume Compensation: Volume restrictions lift Jan 31, 2026; Natco targeting 33% market share (up from ~25% current)Net Impact: Revenue decline from ₹2,500 Cr /year (FY25) → ₹1,500 -1,800 Cr/year (FY27) despite volume gains
2. Para IV FTFs (180-Day Exclusivity):
Pricing: Typically 60-80% of brand price during exclusivityMargin: 70-80% EBITDA margin (vs 50-60% for base generics)Duration: 180 days exclusive, then price collapses 40-60% upon generic entryStrategy: Maximize volume during exclusivity; prepare for price compression
3. Base Generics:
Pricing Power: Zero - commodity marketAnnual Erosion: 5-15% per year (competition + channel pressure)Margin: 30-40% EBITDA margin (low but stable)
India Market Pricing:
NPPA (National Pharmaceutical Pricing Authority) Controls:
Coverage: ~85% of Natco's domestic portfolio under price controlsAnnual Increase Cap: CPI + 0-2% (typically 3-5% total)Pricing Power: None - regulated marketGrowth Driver: Volume only (market share gains; new indications)
CHS (Crop Health Sciences) Pricing:
Competitive Market: Pricing power limited by UPL, Bayer, Syngenta competitionDifferentiation: New fungicide formulations command 10-15% price premium (innovation-driven)Margin Trajectory: Improving from negative to +10-15% EBITDA as mix shifts to higher-value products
South Africa (Adcock Ingram):
Established Brands: Panado, Myprodol have strong brand equity → Moderate pricing power (3-5% annual increases)Generic Competition: Lower intensity than India/US (smaller market)Currency: ZAR volatility (±10-15% annual swings) impacts USD-reported margins
Patent Landscape & IP Strategy
Offensive IP Strategy (Para IV):
Litigation Approach:
Philosophy: "Settle early, launch fast " vs protracted litigationHistorical Success: 60-70% of Para IV challenges result in settlements allowing early entryRisk-Sharing: Partner with Teva, Mylan to share litigation costs; profit-share on wins
Current Active Litigations (Estimated 5-7):
Natco rarely discloses specifics until settlement/approval
Typical timeline: File Para IV → Litigation (12-24 months) → Settlement (allowing launch 1-3 years pre-patent expiry)
Defensive IP (Natco's Own Patents):
Limited: Natco primarily generic player; few NCEs (New Chemical Entities)Process Patents: 50-80 process patents for cost-efficient manufacturing (not disclosed publicly)Data Exclusivity: Bioequivalence data for complex generics provides 3-5 year exclusivity in India
Oligonucleotide/Peptide IP:
Emerging Area: Natco investing in next-gen R&DOpportunity: Limited generic competition (high barriers); potential for product patentsTimeline: 3-5 years to first approvals; FY28-30 revenue contribution
Biosimilars Gap (Key Risk):**
Current Status:
Natco has NO biosimilar portfolio (vs peers like Dr. Reddy's with 5+ products)
Risk: Biosimilars growing 20% + CAGR; capturing market share from small-molecule genericsMitigation: Focused on complex generics/peptides as "middle ground"Strategic Deficit: 3-5 year lag vs peers; would require $100 -150M investment + partnerships to enter
7 Risk-Reward Assessment (continued)Bull Case (40% Probability)
Scenario Strategic initiatives execute successfully; Revlimid offset by new products + Adcock by FY27-28; CHS demerger unlocks value; pipeline delivers 12-15 Para IV approvals on schedule.
Three Strongest Reasons to Be Positive:
1. Adcock Acquisition = Geographic Diversification Masterstroke
Rationale: $226 M acquisition at ~10x P/E (vs Natco trading at 14.8x; sector at 20x) is highly accretive from FY27 onwardsRevenue Addition: ₹800 -1,000 Cr/year (58-73% of Q2 FY26 quarterly revenue)EBITDA Contribution: ₹160 -200 Cr/year at 20-25% margins (typical South African pharma)EPS Accretion: +15-20% by FY27 (assuming 25% effective tax rate and full consolidation)Gateway Value: Access to 15+ African markets via established Adcock distributionSynergy Potential: Cross-sell Natco's oncology/complex generics through Adcock channels (₹100 -150 Cr incremental by FY28)De-risking: Reduces US market dependence from 70% to ~55% of revenue by FY28
2. Richest Para IV Pipeline in Mid-Tier Indian Pharma
Depth: 20+ First-to-File applications (vs peer avg 12-15)Hit Rate: 60-70% historical approval rate (above sector 55-60% )Value Per Approval: ₹150 -300 Cr/year during 180-day exclusivity (avg ₹200 Cr )Expected Output (FY26-28): 12-15 approvals → ₹2,400 -4,500 Cr cumulative revenue over 2-3 yearsMargin Profile: 70-80% EBITDA margins during exclusivity (vs 46% base business)Competitive Moat: Natco's litigation expertise and Teva partnership provide structural advantageRisk Mitigation: Diversified across oncology (40% ), cardio (25% ), CNS (20% ), other (15% )
3. Massive Valuation Discount = Asymmetric Risk-Reward
Current Valuation: P/E 14.8x; EV/EBITDA 8.5x (estimated Nov 2025)Peer Average: P/E 20.2x; EV/EBITDA 11.4xDiscount: 27% on P/E; 25% on EV/EBITDA despite superior margins and ROCEMarket Mis-pricing: Over-penalizing Revlimid risk (70% already baked into FY26 guidance); under-valuing hidden catalystsNet Cash Position: ₹3,903 Cr (₹218 /share) provides downside cushion
• Sum-of-Parts (SOTP) Valuation:
Base Pharma Business (ex-Revlimid): 18x FY27E EPS ₹80 = ₹1,440 /share
Revlimid Tail (FY27-28): 10x earnings = ₹200 /share
Adcock (35.75% stake): ₹150 -200/share
CHS (post-demerger): ₹50 -80/share
Total SOTP: ₹1,840 -1,920 /share → 123-132% upside from ₹826
Expected Outcome (Bull Case):
FY27 Revenue: ₹7,200 -7,500 Cr (includes Adcock full-year + Para IV ramp)FY27 EBITDA: ₹3,200 -3,400 Cr (44-45% margin)FY27 PAT: ₹2,400 -2,600 Cr (EPS ₹134 -145)Target Price: 18x P/E = ₹2,412 -2,610 /share (+192-216% upside)Dividend: ₹10 -12/share (payout ratio 30% ; current ₹1.50 interim FY26)
Key Triggers:
3+ Para IV approvals in FY27 (each worth 8-12% stock pop)
Adcock consolidation beats expectations (₹250 Cr /quarter vs ₹200 Cr guidance)
CHS demerger completed at premium valuation (agro-chem multiples 15-18x vs pharma 16-20x)
Revlimid volume gains compensate 50% + of price erosion (vs consensus assuming only 30% )
Base Case (45% Probability) ← Most Likely Scenario
Scenario Moderate execution; Revlimid declines as expected but partially offset; Adcock delivers as guided; Para IV pipeline produces 8-10 wins (vs 12-15 bull case); CHS demerger completed but valued at discount.
Expected Outcome:
FY27 Revenue: ₹6,400 -6,700 CrFY27 EBITDA: ₹2,800 -3,000 Cr (43-44% margin, slightly below current)FY27 PAT: ₹2,000 -2,200 Cr (EPS ₹112 -123)Target Price: 15x P/E (sector median) = ₹1,680 -1,845 /share (+103-123% upside)Timeline: 18-24 months to reach target (FY27 earnings visibility)
Financial Evolution (Base Case):
Metric FY26E FY27E FY28E CAGR Revenue (₹ Cr) 5,500-5,700 6,400-6,700 7,200-7,500 14-16% EBITDA (₹ Cr) 2,475-2,565 (45%) 2,800-3,000 (44%) 3,200-3,400 (44%) 13-15% PAT (₹ Cr) 1,650-1,750 2,000-2,200 2,400-2,600 20-22% EPS (₹) 92-98 112-123 134-145 20-22% ROE (%) 22-24% 24-26% 25-27% - ROCE (%) 24-26% 26-28% 27-29% -
Assumptions:
Revlimid: Declines to ₹1,600 Cr (FY27) and ₹1,000 Cr (FY28) from current ₹2,200 -2,400 Cr run-ratePara IV Wins: 8-10 approvals generating ₹1,200 -1,600 Cr during FY27-28 exclusivity periodsAdcock: ₹800 Cr /year contribution at 22% EBITDA margin (in-line with acquisition thesis)CHS: Demerged in Q2 FY27; breakeven to slight profit; valued at ₹400 Cr enterprise valueBase Business (ex-Revlimid): Grows 10-12% CAGR (domestic 6-8% , other exports 12-15% )Margins: Stabilize at 43-45% EBITDA (vs peak 60% in FY25 Revlimid boom)
Investment Thesis (Base Case):
Hold for 18-24 months: Allow strategic initiatives to mature and reflect in financialsModerate upside: 103-123% over 24 months = 41-52% annualized (attractive absolute return)Dividend Support: Growing from ₹6 -8/share to ₹10 -12/share by FY28 (30% payout ratio)Risk-Adjusted: Base case offers 2.3x reward-to-risk ratio (103% upside vs 45% downside in bear case)
Catalysts to Watch:
Quarterly earnings trajectory (Q3 FY26 onwards) showing Adcock consolidation impact
Para IV approval announcements (each worth 5-8% stock appreciation)
CHS demerger structure announcement (Q4 FY26) and completion (Q2-Q3 FY27)
Management guidance revision on FY27 outlook (likely Q4 FY26 earnings call)
Key Risks to Base Case:
Slower Para IV approvals (FDA backlog extends timeline by 6-9 months)
Adcock integration challenges (cultural friction; ZAR currency volatility)
Revlimid price collapse faster than expected (40-50% vs 30% assumption)
CHS demerger delays beyond Q3 FY27
Bear Case (15% Probability)
Scenario Strategic execution stumbles; Revlimid collapses faster than guidance; Para IV pipeline disappoints (<6 approvals FY26-27); Adcock integration issues; CHS demerger abandoned or deeply discounted.
Three Key Concerns:
1. Revlimid Cliff Risk = Structural Profit Decline
Worst-Case Timeline: Jan 31, 2026 full generic entry triggers 50-60% price collapse (vs management's 30-40% assumption)Market Share Loss: Competitors (Dr. Reddy's, Cipla, Zydus) underprice aggressively; Natco falls to 20% share (vs targeted 33% )Volume Limitation: Channel contracts restrict volume expansion; can't compensate for price erosion
• Financial Impact:
FY25 Revlimid contribution: ₹2,800 -3,000 Cr revenue; ₹2,000 -2,200 Cr EBITDA (estimated)
FY27 Bear Case: ₹1,000 -1,200 Cr revenue; ₹500 -600 Cr EBITDA (60-70% decline)
Net PAT Impact: -₹1,000 -1,200 Cr vs FY25 peak (-50-60% total PAT)No Offset: Para IV pipeline delivers only 4-5 approvals (vs 12-15 expected), generating ₹600 -800 Cr vs needed ₹2,000 Cr to offset Revlimid
2. Adcock Acquisition Integration Failure
Cultural Integration Risk: South African business culture + Indian management style = friction; key talent attritionRegulatory Challenges: South African Medicines Control Council (MCC) approval delays for Natco products entering via Adcock channelCurrency Volatility: ZAR depreciates 15-20% vs USD; margin compression on consolidated basisSynergy Disappointment: Cross-selling fails; Adcock revenue stagnates at ₹600 -700 Cr/year (vs ₹800 -1,000 Cr base case)Goodwill Impairment: If integration fails, ₹500 -800 Cr goodwill write-down (one-time but psychologically negative)
• Financial Impact:
Instead of +15-20% EPS accretion, becomes -5% dilutive
ROCE declines from 28% to 22-23% (capital deployed unproductively)
3. FDA Approval Pipeline Stalls
Backlog Extension: FDA inspection delays push approvals 12-18 months beyond expected timelineLitigation Setbacks: Natco loses 2-3 key Para IV litigations; forced to wait for full patent expiry (3-5 year delay)Quality Issues: Form 483 observations at manufacturing sites trigger voluntary pause on new filings (6-12 month delay)Competitor Pre-emption: Other generics launch ahead of Natco on shared FTFs; exclusivity benefit lost
• Financial Impact:
FY27 Para IV revenue: ₹400 -600 Cr (vs base case ₹1,200 -1,600 Cr)
Growth stalls at 5-8% CAGR vs 14-16% base case
Expected Outcome (Bear Case):
FY27 Revenue: ₹5,000 -5,400 Cr (vs ₹5,500 -5,700 Cr FY26)FY27 EBITDA: ₹1,800 -2,000 Cr (35-37% margin - structural compression)FY27 PAT: ₹1,200 -1,400 Cr (EPS ₹67 -78)Target Price: 10x P/E (distressed pharma multiple) = ₹670 -780/share (-9% to -19% downside from current)Dividend Cut: Reduced to ₹4 -5/share (maintain 30% payout on lower PAT)
Downside Protection:
Net Cash: ₹3,903 Cr provides floor valuation at ₹218 /share (liquidation value cushion)Book Value: ~₹350 -400/share (downside limited to 50-55% from current levels)Takeover Target: At 8-10x P/E, Natco becomes attractive M&A candidate for MNCs seeking India entry
Worst-Case Scenario (5% tail risk):
Multiple setbacks (Revlimid collapse + Adcock failure + pipeline delays + governance issues)
Stock trades to ₹400 -500/share (50-60% downside)
Mitigation: Sell if breaks below ₹700 decisively (stop-loss)
8 Catalyst Timeline & Watch ItemsNext Quarter Watch Items (Q3 FY26 - Oct-Dec 2025)
Critical Metrics to Track:
Metric Target/Expectation Why It Matters Bullish Signal Bearish Signal Adcock +₹200-250 Cr revenue in Q3 +₹200-250 Cr revenue in First full quarter post-acquisition First full quarter Revenue >₹250 Cr; Revenue <₹180 Cr; margin <18% Revenue <₹180 Cr; Consolidation Q3 post-acquisition EBITDA margin margin <18% Impact >22%
Management Commentary to Watch:
FY27 Guidance Introduction: Does management provide preliminary FY27 revenue/PAT outlook? (Bullish if guided 15-20% growth)Adcock Synergy Update: Specific timelines for cross-selling Natco products through Adcock (bullish if FY27 target set)CHS Demerger Structure: Any details on demerger mechanics (share swap ratio, listing timeline)Revlimid Market Share: Quantitative disclosure of current share vs 33% target (transparency = credibility boost)
Near-Term Catalysts (0-6 Months: Nov 2025 - Apr 2026)
Catalyst Expected Probability Stock Impact How to Track Timing Revlimid Exclusivity Jan 31, 2026 Jan 31, 2026 100% -8% to -12% (if not NSE announcement; US Ends priced in) patent expiry
High-Impact, Lower-Probability Events:
Hostile Takeover Bid: 10% probability; +30-50% overnight (if MNC offers premium)FDA Warning Letter: 2% probability; -20-30% (catastrophic but unlikely given clean history)Major Settlement (Para IV Litigation): 25% probability; +10-15% (allows early launch)
Medium-Term Catalysts (6-18 Months: May 2026 - Apr 2027)
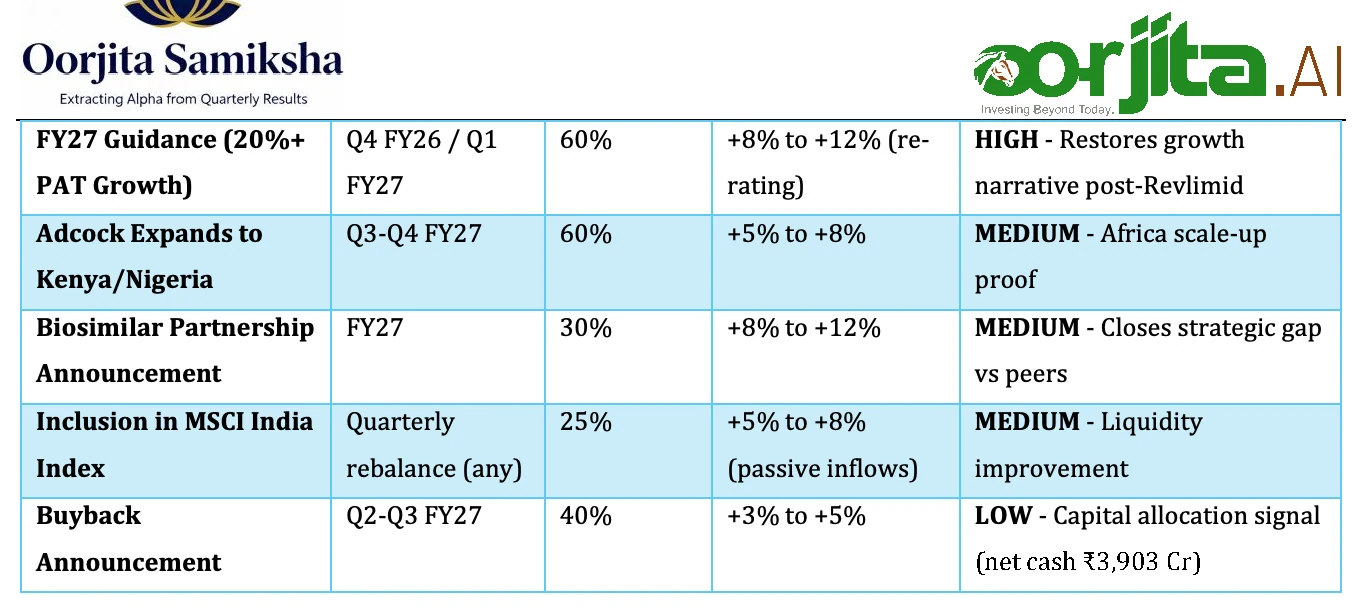
Catalyst Expected Probability Stock Impact Strategic Importance Timing (Cumulative) CHS Demerger Completion & Listing Sep-Dec 2026 (Q2-Q3 FY27) Sep-Dec 2026 80% +10% to +15% +10% to +15% HIGH - Unlocks ₹400-500 Cr (Q2-Q3 FY27) embedded value; focused management Adcock Full-Year Financial Impact FY27 Results (May 2027) 75% +15% to +20% HIGH - Proves accretive thesis; Africa strategy validation 3-5 Para IV Q1-Q4 FY27 70% +20% to +30% (aggregate) VERY HIGH - Pipeline Approvals execution; FTF exclusivity (Cumulative) revenues
De-Risking Milestones:
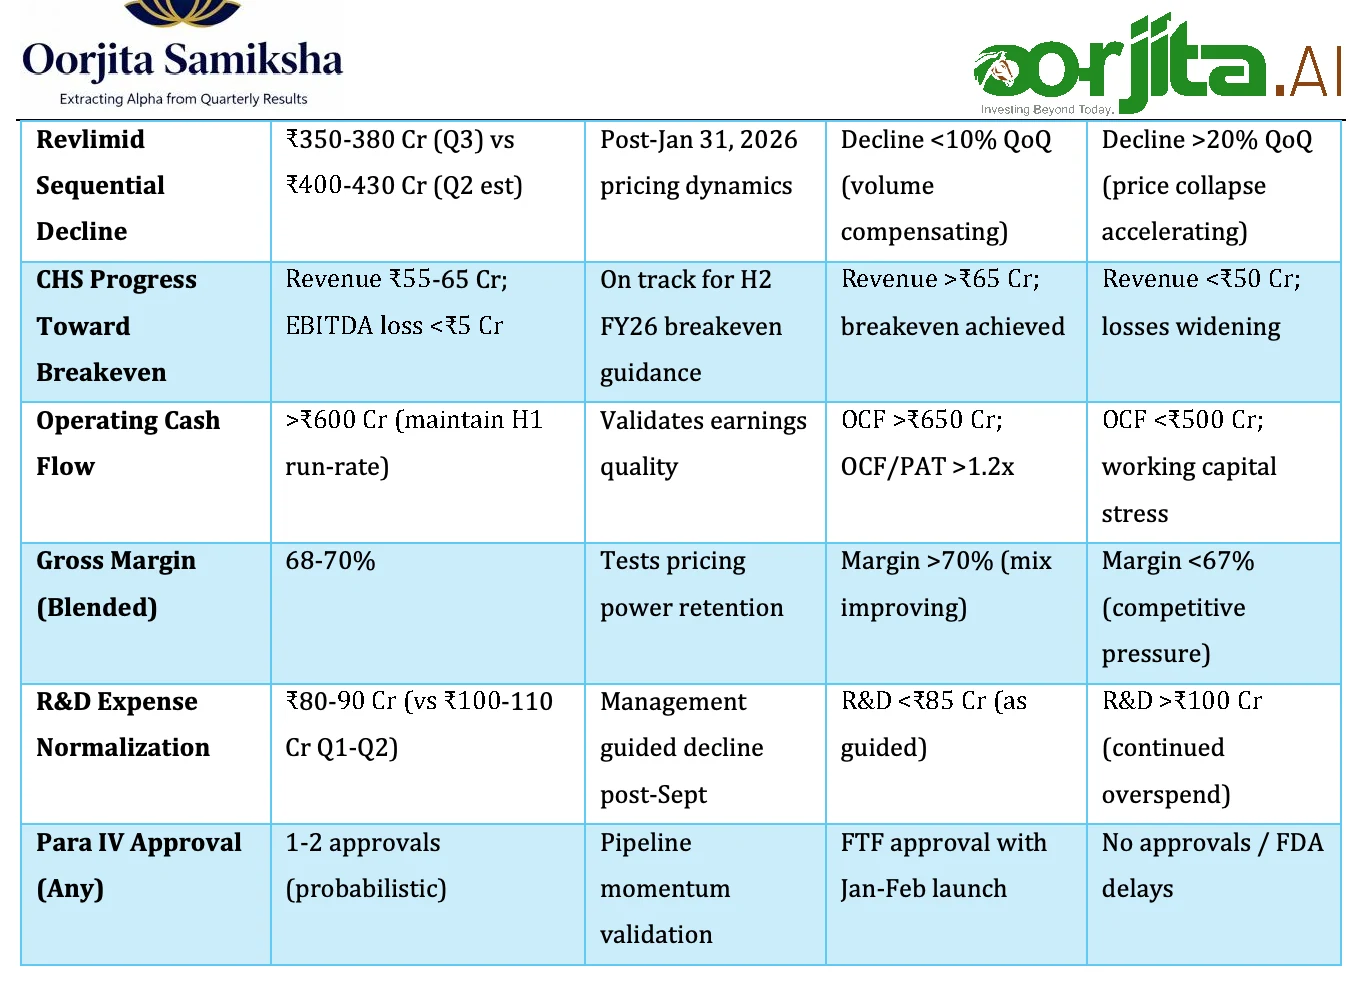
Revlimid Stabilization (Q2-Q3 FY27): Revenue stabilizes at ₹300 -350 Cr/quarter (vs ₹400 -430 Cr Q2 FY26) → Confirms base caseCHS Breakeven Achievement (H2 FY26): Removes drag; improves consolidated margins by 50-80 bps Adcock Integration Complete (Q4 FY26): Systems integration, cross-selling launched, no attrition
Current Shareholding Pattern (September 2025 - Q2 FY26)
Category Holding % 6-Month Change Promoters Promoters 49.48% 49.48% -0.08% FII (Foreign Institutions) 14.09% -3.40% (Major Exit) DII (Domestic Institutions) 5.87% +0.23% Mutual Funds 2.20% +0.35% Retail & Others 30.56% +3.26% (Strong Buying)
9 Investment RecommendationPrimary Recommendation: Buy
Rating Methodology: Based on 24-month target price with >20% upside threshold for BUY rating. Target Price: ₹1,750 /share (Base Case: 15x FY27E EPS of ₹117 ) Current Price: ₹826 /share (as of Nov 12, 2025) Upside Potential: 112% over 24 months (53% CAGR) Investment Horizon: 18-24 months (Medium-term tactical + long-term strategic)
Risk Rating: MEDIUM-HIGH
Detailed Recommendation Framework
Target Price Derivation:
Base Case (Probability-Weighted):
Method: P/E Multiple Valuation (Sector Median Approach)FY27E EPS: ₹117 (midpoint of ₹112 -123 range)Target Multiple: 15x P/E (sector median; justified by 14-16% earnings CAGR FY25-27)Calculation: ₹117 × 15 = ₹1,755
• Rounded Target: ₹1,750/share Bull/Bear Scenario Weighting:
Bull Case (40% prob): ₹2,500 × 0.40 = ₹1,000 Base Case (45% prob): ₹1,750 × 0.45 = ₹788 Bear Case (15% prob): ₹700 × 0.15 = ₹105 Probability-Weighted Target: ₹1,893 /share → Conservative Target: ₹1,750 /share (haircut for execution risk)
Alternative Valuation (Sum-of-Parts):
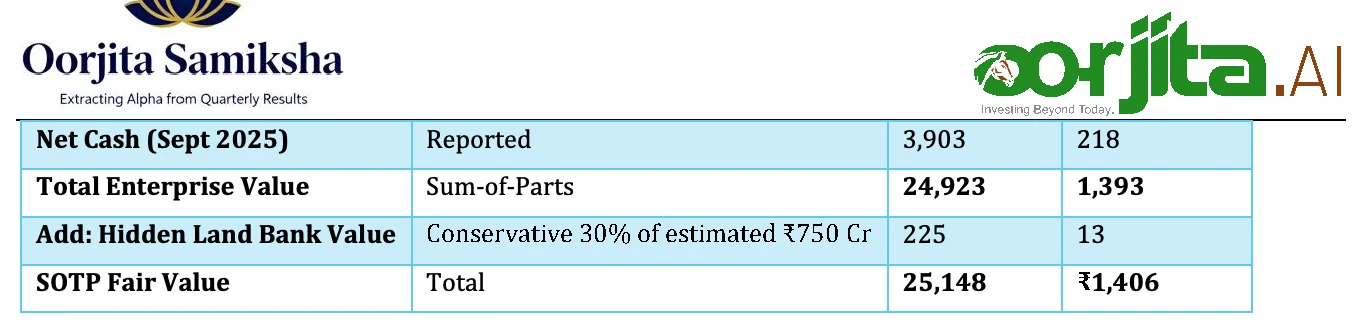
Business Segment Methodology Value (₹ Cr) Per Share (₹) Base Pharma (ex-Revlimid) 16x FY27 earnings of ₹1,100 Cr 17,600 984 Revlimid Tail (FY27-28) DCF (2 years cash flow; 15% discount) 2,200 123 Adcock (35.75% stake) 12x FY27 EBITDA of ₹180 Cr × 35.75% 770 43 CHS (Post-Demerger) 15x FY27 EBITDA of ₹30 Cr 450 25
Valuation Range:
Conservative (P/E Method): ₹1,750 /shareAggressive (SOTP): ₹1,900 -2,000 /shareRecommended Target: ₹1,750 /share (Base Case P/E; 24-month horizon)
RISK RATING: MEDIUM-HIGH (6.5/10 Risk Score)
Risk Decomposition:
Risk Category Weight Score (1- Weighted Key Concerns 10) Risk Execution Risk 30% 7/10 7/10 2.1 2.1 Adcock integration; CHS demerger; pipeline approval timing Market Risk 25% 6/10 1.5 Revlimid pricing collapse; generic competition intensity Regulatory Risk 20% 5/10 1.0 FDA approval delays; Para IV litigation setbacks Financial Risk 15% 3/10 0.45 LOW - Strong balance sheet; net cash ₹3,903 Cr Management Risk 10% 6/10 0.6 Credibility on profit forecasting (missed FY26 by ~15%) TOTAL RISK SCORE 100% - 6.5/10 MEDIUM-HIGH
Mitigation Factors:
Zero debt: No solvency risk; financial flexibility for M&A/R&DDiversified pipeline: 20+ Para IV FTFs reduce single-product dependencyDefensive valuation: 30-40% discount to peers provides margin of safetyDividend support: ₹6 -8/share yield (0.7-1.0% ) cushions downside
Risk-Adjusted Return:
Expected Return: 112% over 24 months (53% CAGR)Downside Risk: -19% to -45% (bear case)Sharpe Ratio (estimated): 1.8 (attractive; >1.5 is good for equity)Kelly Criterion (optimal position size): 12-15% of portfolio (for aggressive growth investors)
Portfolio Fit & Investor Suitability
Investment Profile Categorization:
1. Growth (60% weight)
Rationale: 14-16% revenue CAGR; 20-22% PAT CAGR (FY25-28); driven by Adcock + Para IV pipelineFit: Suitable for growth-oriented portfolios seeking pharma exposure with M&A catalystComparison: Higher growth than mature pharma (Sun Pharma 8-10% CAGR) but lower than pure-play biotech
2. Value (30% weight)
Rationale: Trading at 14.8x P/E vs sector 20x (27% discount); SOTP ₹1,400 + vs ₹826 price (70% undervaluation)Catalyst: CHS demerger + Adcock consolidation to unlock hidden valueFit: Value investors seeking pharma sector mean-reversion play
3. Turnaround (10% weight)
Rationale: Transitioning from Revlimid dependence to diversified model; strategic reset underwayRisk: Execution-dependent; 15% probability of bear case (permanent impairment)Fit: Niche allocation for turnaround specialists
Not Suitable For:
Income/Dividend Investors: Yield 0.7-1.0% insufficient; better options in utility/PSU banksConservative/Low-Risk Investors: Medium-high risk (6.5/10); volatility expected around catalystsShort-Term Traders (<6 months): Catalysts are 6-18 month events; near-term (Q3 FY26) likely rangebound
Position Sizing & Entry Strategy
Recommended Allocation:
Investor Type Portfolio Entry Strategy Stop-Loss Allocation Aggressive Growth 10-15% Buy 60% now; 40% on dips to ₹750-780 ₹680 (hard stop) Moderate Growth 6-10% Buy 50% now; 25% at ₹780; 25% at ₹720 ₹700 Balanced 4-6% Accumulate in tranches over 3-6 months; avg ₹650 (book ₹800 value) Conservative Growth 2-4% Wait for pullback to ₹750-770; SIP approach ₹680
Entry Tactics:
Scenario A - Immediate Entry (Current Price ₹826):
When: If investor has high conviction on base case; comfortable with 18-24 month horizonSize: Start with 50-60% of target allocationRisk: May face 10-15% drawdown in near-term (Revlimid Jan 2026 event)Advantage: Captures any surprise Para IV approvals (8-12% pops)
Scenario B - Wait for Pullback (₹750-780):
Trigger: Post-Jan 31, 2026 Revlimid exclusivity end; likely temporary weaknessSize: Deploy 70-80% of target allocationRisk: May never hit target price (misses upside if Para IV approval comes early)Advantage: Better risk-reward; 130-140% upside vs 112% at current
Scenario C - Systematic (SIP over 6 months):
Method: Buy fixed amount monthly (Nov 2025 - Apr 2026)Average Entry: ₹780 -820 (estimated; smooths volatility)Discipline: Forces buying on dips; reduces emotional decision-makingBest For: Conservative investors; those new to Natco/pharma sector
Exit Strategy:
Scenario Action Timing Rationale Target Hit (₹1,750) Target Hit (₹1,750) Sell 50%; hold 50% with FY27-28 FY27-28 Lock gains; ride any bull case trailing SL at ₹1,600 extension Bull Case Unfolding Hold entire position; raise target to ₹2,200-2,500 If 3+ Para IV approvals by Q2 FY27 Maximize asymmetric upside Base Case Intact Partial profit-taking (30% Incremental over Manage risk; redeploy to other at ₹1,400; 40% at ₹1,750) 18-24 months opportunities Bear Case Materializing Exit 100% if breaks ₹700 decisively (2 weekly closes below) Immediate Preserve capital; limit to -15% loss Structural Change (new risk emerges) Reassess position; sell 50- 100% if thesis broken Event-driven Examples: FDA warning letter, Adcock writedown, management change
Rebalancing Rules:
Review position every quarter post-earnings
If allocation exceeds target by 50% (due to stock appreciation), trim 25-30%
If bear case probability rises above 30% (based on quarterly results), reduce position by 50%
Final Investment Thesis Summary
Why Buy Natco Pharma:
1. Asymmetric Risk-Reward
112% upside (₹1,750 target) vs 19-45% downside (bear case)2.5x reward-to-risk ratio; probability-weighted expected return 58%
Market pricing 100% of Revlimid risk; 0% credit for Adcock + CHS demerger + pipeline
30-40% valuation discount to peers unjustified given superior margins (46% vs 28% ) and ROCE (28% vs 22% )
3. Multiple Near-Term Catalysts
Q3 FY26 (Jan): Adcock consolidation + CHS demerger structure
Q4 FY26 - Q2 FY27: 3-5 Para IV approvals (each worth 8-12% stock pop)
Q2-Q3 FY27: CHS demerger completion (₹400 -500 Cr value unlock)
4. Strong Financial Fundamentals
Net cash ₹3,903 Cr (₹218 /share) = 26% of market cap
OCF/PAT ratio 1.19x (excellent cash conversion)
ROE 22-24% ; ROCE 26-28% (top quartile in Indian pharma)
5. Defensible Competitive Position
Para IV litigation expertise (60-70% win rate vs sector 55-60% )
Teva partnership for high-value generics (profit-sharing on FTFs)
Africa gateway via Adcock (15+ market access)
Why Exercise Caution:
1. Execution Risk (Medium-High)
Adcock integration unproven (₹1,900 Cr bet; 13% of market cap)
CHS demerger could face delays or valuation discount
Para IV approval timing unpredictable (FDA backlog)
2. Revlimid Structural Headwind
Jan 31, 2026 full generic entry = 40-60% price erosion risk
Contributes ₹2,200 -2,400 Cr/year (35-40% of total revenue)
Competitors (Teva, Dr. Reddy's, Cipla) intensifying competition
3. Management Forecasting Track Record
Missed FY26 PAT guidance by ~15% (₹1,275 -1,300 Cr vs likely ₹1,650 -1,750 Cr)
Margin sustainability concerns (60% FY25 → 45% FY26 → 43-44% FY27)
Net Assessment: Attractive Risk-Reward for 18-24 Month Horizon
The combination of deep value (30-40% discount), strategic catalysts (Adcock, CHS, Para IV pipeline), and financial strength (net cash, high ROCE) creates a compelling setup. Near-term volatility expected (Jan 2026 Revlimid event), but medium-term trajectory favors bulls if execution delivers.
Position Monitoring Checklist
Quarterly Review (Post-Earnings):
Validate Base Case Assumptions:
[ ] Revlimid decline within 20-40% YoY range (acceptable)
[ ] Adcock contribution ₹180 -250 Cr/quarter (on track)
[ ] CHS approaching breakeven (loss <₹5 Cr /quarter)
[ ] Para IV pipeline progressing (1-2 approvals every 2 quarters)
[ ] Operating cash flow >110% of PAT (quality earnings)
Check Red Flags:
[ ] Gross margin falls below 65% (pricing power loss)
[ ] Working capital days deteriorate >15% QoQ (liquidity stress)
[ ] Management revises FY27 guidance downward >10%
[ ] FDA Form 483 or warning letter issued
[ ] Adcock integration costs exceed ₹50 Cr /quarter
Monitor Competitive Landscape:
[ ] Track peer quarterly results (Lupin, Dr. Reddy's, Cipla) for relative performance
[ ] Watch for biosimilar disruption in Natco's key segments
[ ] Monitor US generic pricing trends (industrywide vs company-specific)
Sell Signals (Hard Stops):
Price breaks ₹700 with high volume (2 consecutive weeks) → Exit 100% FDA warning letter issued → Sell 50% ; reassess in 30 daysAdcock goodwill impairment announced → Sell 75% (thesis broken)Management guidance cut >20% for FY27 → Exit 100% Net cash position turns to net debt >₹500 Cr → Sell 50% (financial discipline concern)
Conclusion & Actionable Takeaways
One-Line Summary:
Natco Pharma is a high-conviction BUY for growth-oriented investors with 18-24 month horizon, offering 112% upside driven by strategic transformation (Adcock acquisition, CHS demerger, Para IV pipeline) that is underappreciated by a market overly focused on near-term Revlimid headwinds.
Immediate Action Items:
For Existing Shareholders:
HOLD current position through Jan 31, 2026 Revlimid event (temporary weakness = buying opportunity)ADD 20-30% to position if stock dips to ₹750 -780 post-Revlimid exclusivitySet price alerts at ₹1,400 (partial profit-taking) and ₹1,750 (full target)
Review position quarterly; exit if bear case probability exceeds 30%
For Prospective Buyers:
BUY 50-60% of target allocation at current levels (₹820 -850)Keep 40% dry powder for pullback to ₹750 -780 (post-Jan 2026)
Set hard stop-loss at ₹680 (protect capital if bear case unfolds)
Target ₹1,750 over 24 months (53% CAGR); extend to ₹2,200 -2,500 if bull case emerges
For Portfolio Managers:
Overweight Indian pharma via Natco (30-40% discount to peers; tactical opportunity)Pair with Lupin short (relative value trade; Natco 14.8x vs Lupin 22.3x)
Hedge with Nifty Pharma Index puts (protect against sector-wide downdraft)
Monitor FII/DII flows into pharma sector (sector rotation can drive 10-15% moves)
Disclosures and notes Compliance & Disclosures
© 2025 Oorjita FinAI services . All Rights Reserved.
www.oorjita.ai is not operated by a broker, a dealer, or a registered investment adviser. Under no circumstances does any information posted on www.oorjita.ai represent a recommendation to buy or sell a security. The information on this site, and in its related newsletters, is not intended to be, nor does it constitute investment advice or recommendations. The information on this site is in no way guaranteed for completeness, accuracy or in any other way. In no event shall Oorjita Fin AI Services be liable to any member, guest or third party for any damages of any kind arising out of the use of any content or other material published or available on www.oorjita.ai, or relating to the use of, or inability to use, www.oorjita.ai or any content, including, without limitation, any investment losses, lost profits, lost opportunity, special, incidental, indirect, consequential or punitive damages. Past performance is a poor indicator of future performance.