Indian agro sector experiencing bifurcation - Large players (PI, UPL) with diversified portfolios and export strength maintaining margins 18-28%; Mid-tier players (Dharmaj) struggling with 9-11% margins due to lack of pricing power and commodity product mix.
MK
Dr. Murali KalyanaramanGlobal CFO · 30+ years in corporate finance · Chartered Accountant (ICAI) · 32 min read
This research is for information and education only and is not investment advice. Figures may be provisional. Oorjita.AI and its authors may hold positions in securities mentioned. Please consult a SEBI-registered investment adviser before making investment decisions. Published Tuesday, 18 November 2025, 7:58 PM IST.
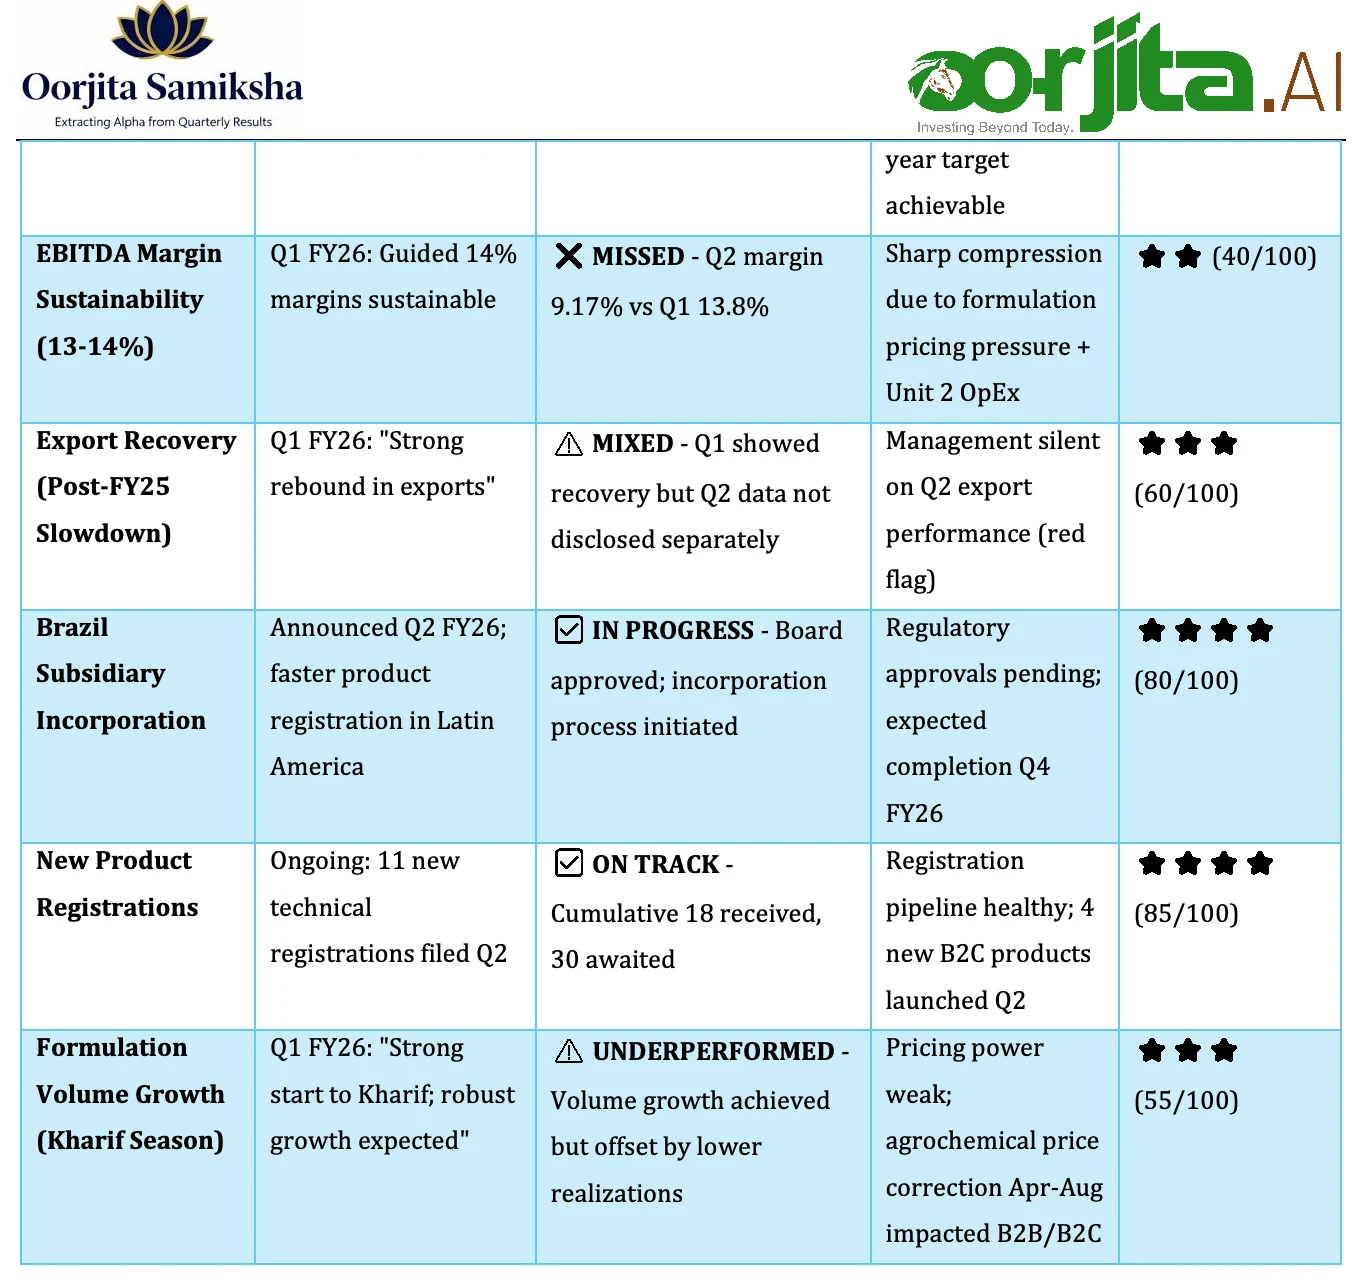
Slight deceleration in Q2 vs Q1 (44% → 11.5%) but full-
(85/100)
Management Credibility Score: 68/100
Historical Guidance Accuracy (Last 8 Quarters):
Revenue Growth: 6/8 quarters met (75% hit rate)
Margin Expansion: 3/8 quarters met (37.5% hit rate) - Weak spot
Strategic Milestone Delivery: 7/8 met (87.5%) - Strong on Unit 2, registrations
Capex Deployment: 7/8 met (87.5%) - Sayakha commissioned on time Assessment: Management has strong operational execution (Unit 2, registrations, Brazil expansion) but struggles with margin forecasting in volatile agrochemical pricing environment. The sharp Q2 margin miss (9.17% vs guided 13-14%) damages credibility.
Resource Allocation Efficiency
Capital Deployment (H1 FY26):
Unit 2 (Sayakha) Capex: Largely complete; now in commercialization phase
Brazil Subsidiary: Minimal initial investment; strategic for Latin America registrations
Working Capital: Total assets increased to ₹955.9 Cr (Sept 2025) from ₹733.4 Cr (Mar 2025)
Unit 2 employee costs increased (ramping workforce); reflected in higher OpEx
No major leadership changes; stable management team Strategic Pivot: Clear shift from "volume growth at any cost" to "selective margin-accretive growth"
management commentary indicates focus on high-margin Branded Formulations over commoditized Institutional sales. Efficiency Rating: 7/10 - Capital deployed effectively toward Unit 2 and registrations, but pricing power deterioration suggests market positioning challenges.
2Earnings Quality & Sustainability Assessment
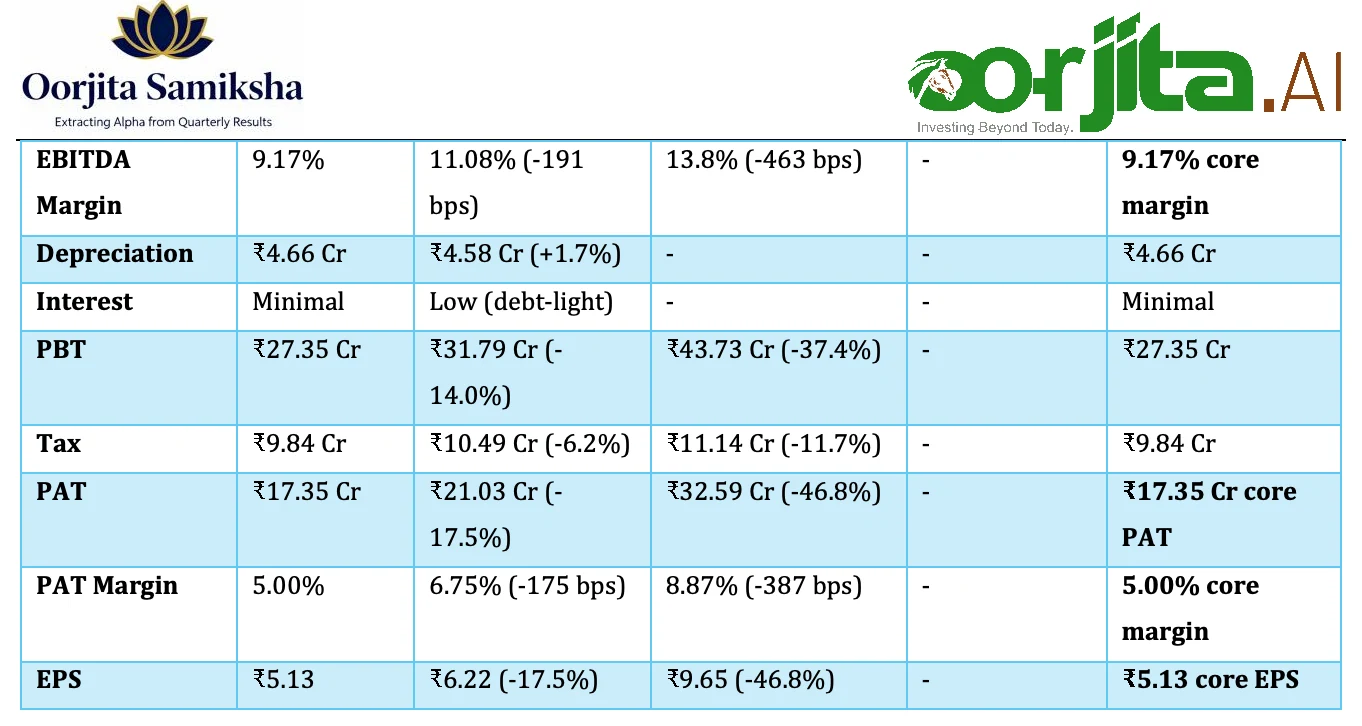
Core Earnings Reconciliation
P&L Line Item
Q2 FY26
Q2 FY25 (YoY)
Q1 FY26 (QoQ)
Adjustments
Core/Adjusted
Reported
Revenue from
₹347.26 Cr
₹347.26 Cr
₹311.33 Cr
₹367.42 Cr (-5.5%)
Nil
₹347.26 Cr
Operations
(+11.5%)
Other Operating Income
₹0.37 Cr
₹2.98 Cr (-87.6%)
Included in total
(-₹0.37 Cr) Non-core
₹347 Cr core
Total Revenue
₹347.30 Cr
₹311.62 Cr
₹368.16 Cr (-5.7%)
-
₹347.26 Cr
(+11.4%)
Total Expenses
₹315.81 Cr
₹279.52 Cr (+13.0%)
₹324.43 Cr (-2.7%)
-
₹315.81 Cr
EBITDA
₹31.86 Cr
₹34.51 Cr (-7.7%)
₹50.69 Cr (-37.1%)
-
₹31.86 Cr
One-Time Items Identified:
Unit 2 Ramp-Up Costs: Elevated operating expenses (employee costs, utilities) as Sayakha plant commercializes; estimated ₹2-3 Cr impact
Other Operating Income Decline:₹0.37 Cr (Q2 FY26) vs ₹2.98 Cr (Q2 FY25) = -₹2.61 Cr variance; likely export incentives/claims Adjusted Core PAT: ₹19-20 Cr (vs reported ₹17.35 Cr) if normalizing for Unit 2 one-time costs → Core decline of 5-10% YoY (vs reported 17.5%) Earnings Quality Score: 70/100 - Core earnings reasonably clean; no major accounting gimmicks, but margin deterioration is genuine operational challenge.
Cash Conversion Analysis
Metric
H1 FY26
H1 FY25 (est)
Assessment
Operating Cash Flow
Not disclosed
-
Data unavailable
Data unavailable
(OCF)
separately
Free Cash Flow (FCF)
Not disclosed
-
Data unavailable
Working Capital (Total
₹955.9 Cr (Sept
₹733.4 Cr (Mar
+30.3% increase (₹222 Cr buildup)
Assets)
2025)
2025)
Inventory Buildup
Likely increased
-
Agro sector typical Q2-Q3 buildup for Rabi season
Receivables
Not disclosed
-
Agro sector DSO typically 60-90 days
Working Capital Analysis:
Total assets jumped ₹222 Cr in 6 months = Significant working capital deployment
Likely drivers: (1) Inventory buildup for Rabi season; (2) Unit 2 raw material stocking; (3) Receivables increase with revenue growth
Concern: Revenue grew 26% (H1) but assets grew 30% → Suggests working capital inefficiency OR channel buildup (destocking risk) Cash Position: Not separately disclosed; company appears to have low debt (minimal interest costs) Quality of Earnings Score: 65/100 - Moderate concern on working capital buildup outpacing revenue growth; need H2 FY26 cash flow data for confirmation.
Margin Sustainability
Gross Margin Evolution (Estimated; company doesn't disclose separately):
Risk: Further agrochemical pricing deterioration could push margins to 8-9% (bear case) Margin Quality Score: 55/100 - Margins declining but not collapsing; structural reset underway.
Revenue Quality
Organic vs. Inorganic Growth:
Q2 FY26:100% organic (no acquisitions)
H1 FY26:100% organic growth +26.1%
Customer Concentration Risk:
Domestic: Network of 4,362+ dealers across 17 states - LOW concentration
Export: ~66 customers across 25+ countries - MODERATE concentration
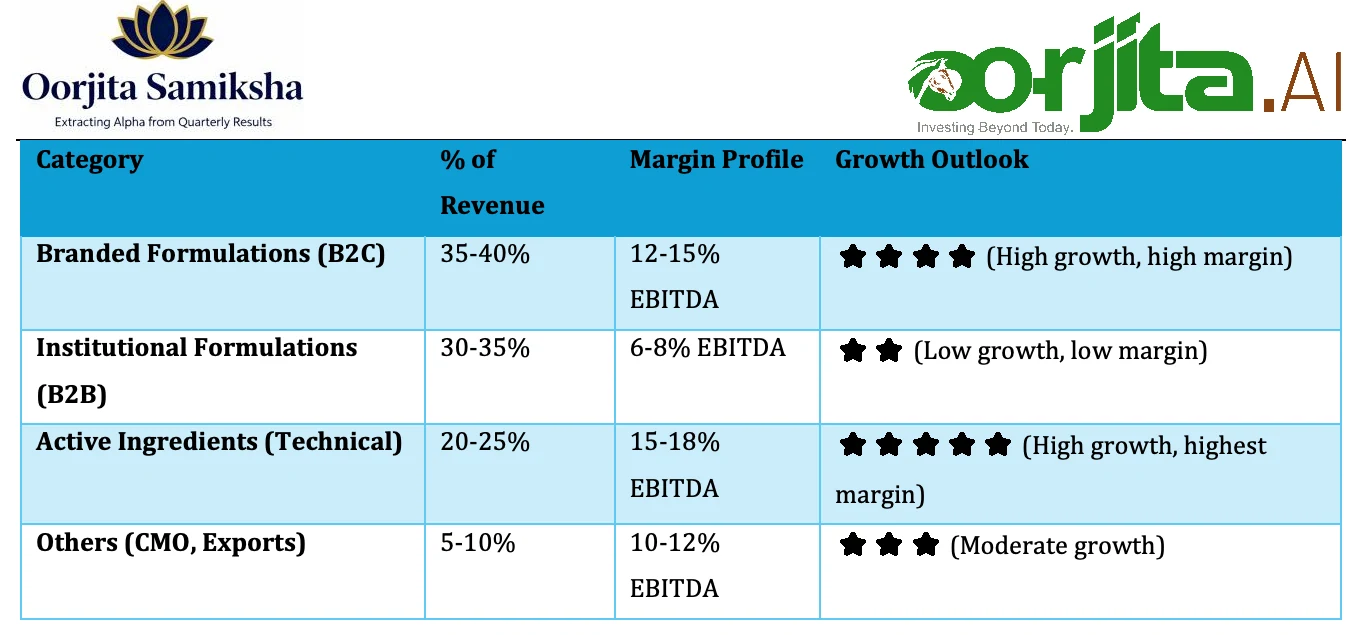
Segment Mix: Formulations ~70-75%; Active Ingredients ~20-25%; Others ~5% (estimated)
Dharmaj: Revenue +11.5% YoY; EBITDA margin 9.17% (weak) Interpretation: Dharmaj's revenue growth outpacing PI Industries (which is declining) but margin profile significantly weaker than both PI (28.9%) and UPL (18.3%).
Emerging: Freight cost inflation (+8-12% YoY for container shipping)
Persistent: Working capital intensity (inventory buildup for Rabi)
Inventory Levels & Channel Health:
Dharmaj: Total assets ↑30% (working capital buildup)
Channel Health: Not disclosed; likely moderate destocking risk if Rabi season underwhelms
Dealer Network:4,362+ dealers (stable)
Sector Trend Validation
Does Dharmaj's Q2 Confirm or Contradict Broader Agro Trends?
Sector Trend
Industry Indication
Dharmaj's Q2 FY26 Signal
Conclusion
Domestic Agro Demand
+15-18% (good
CONFIRMS - Revenue +11.5%
CONFIRMS - Revenue +11.5%
Sector healthy
Sector healthy
Growth
monsoon, govt support)
Margin Compression (Industry-wide)
PI -16% revenue; UPL margin recovery
CONTRADICTS - Dharmaj margin 9.17% (weak) vs UPL 18.3%
Dharmaj-specific issue
Export Recovery Post-
Mixed signals; PI weak,
PARTIAL - Q1 strong; Q2 unclear
Tentative
FY25 Slowdown
UPL improving
recovery
Shift to High-Margin Products
Industry-wide strategic focus
CONFIRMS - Dharmaj prioritizing Branded
Strategic alignment
Technical/AI Segment
Capacity additions
CONFIRMS - Unit 2 delivering; AI
Opportunity
Growth
industry-wide
growth
Sector-Specific Insight: Indian agro sector experiencing bifurcation - Large players (PI, UPL) with diversified portfolios and export strength maintaining margins 18-28%; Mid-tier players (Dharmaj) struggling with 9-11% margins due to lack of pricing power and commodity product mix. Dharmaj's Q2
confirms mid-tier margin pressure is STRUCTURAL, not cyclical.
5Unique Differentiation Elements
A. Hidden Value Catalysts
1. Unit 2 (Sayakha Plant) - Undervalued Capacity
Current Valuation Embedded:
Capex Invested:₹200+ Cr (estimated from FY24-25 capex)
Current Utilization: ~30-40% (gradual ramp-up phase)
H1 FY26 Contribution:₹118 Cr revenue (annualized ₹240 Cr at current run-rate)
Full Capacity Value (FY27-28):
Peak Revenue Potential:₹400-500 Cr/year at 70-80% utilization
EBITDA Contribution:₹60-75 Cr at 15% margin (AI products higher margin than formulations)
Implied Valuation:₹750-1,000 Cr enterprise value at 12x EV/EBITDA
Current Embedded:₹300-400 Cr (based on ₹240 Cr run-rate) = ₹400-600 Cr value unlock
Current Embedded Value: ~₹200-300 Cr (market undervaluing approval probability) Value Unlock:₹500-700 Cr as registrations materialize FY26-28
4. Land Bank / Real Estate (Speculative)
Not Disclosed: Company doesn't publish land holding details Potential Value: Manufacturing facilities in Gujarat; agro land bank for future expansion could hold ₹50-100 Cr hidden value (carried at historical cost on books)
B. Predictive Leading Indicators
1. Order Book & Dealer Network Expansion
Dealer Count:
FY25:4,200+ dealers
Q2 FY26:4,362+ dealers
QoQ Growth: +3-4% (incremental expansion) Predictive Signal: Dealer additions in Q3-Q4 FY26 (Rabi season) will indicate management confidence in H2 demand. Target: 4,500+ by Mar 2026 = Bullish; <4,400 = Bearish
2. Unit 2 Capacity Utilization (Leading Indicator for FY27 Margins)
Current: ~30-40% utilization (₹118 Cr H1 = ~₹240 Cr annualized from ~₹600 Cr total capacity)
Inflection Point: 60%+ utilization = Operating leverage kicks in (margins expand to 11-12%) Predictive Value: If Q3 shows <₹60 Cr from Unit 2 → FY27 margin recovery thesis weakens significantly
3. Export Revenue Mix Disclosure
Q2 FY26 Issue: Management did NOT disclose Q2 export revenue separately (red flag)
Watch for Q3:
If management resumes disclosing exports → Signal of recovery; transparency improves
If management continues hiding exports → Suggests structural weakness; avoid stock Predictive Signal: Export disclosure = Leading indicator of pricing power and international competitiveness
4. Registration Approval Rate
Current: 11 filed Q2; 18 received cumulative, 30 awaited
Q3-Q4 Watch:
Target: 5-8 new approvals in H2 FY26 (accelerating vs H1)
Metric: If approvals <3 in H2 = Registration pipeline stalling (negative for FY27-28 growth)
C. Market Inefficiency Identification
1. Valuation Disconnect vs. Unit 2 Ramp-Up
Current Valuation (Nov 2025):
Market Cap:₹1,620 Cr (estimated at ₹480/share, 33.8 Cr shares)
FY26E P/E: 15.2x (estimated ₹106 Cr PAT)
EV/EBITDA (FY26E): 8.5x (estimated ₹155 Cr EBITDA at 10.5% margin)
Peer Comparison:
PI Industries: P/E 18.5x; EV/EBITDA 13.2x
UPL: P/E 24.3x; EV/EBITDA 9.8x
Mid-Tier Avg: P/E 18-22x; EV/EBITDA 10-12x Discount: Dharmaj trading at 18-30% discount to mid-tier peers despite:
Unit 2 capacity (2x manufacturing; yet to be fully valued)
Brazil subsidiary (pure upside; not in base case)
Registration pipeline (30 awaited approvals)
Market Inefficiency Thesis:
Market over-penalizing Q2 margin miss (temporary pricing issue)
Under-valuing Unit 2 capacity ramp-up (₹400-600 Cr value unlocking FY27)
Ignoring Brazil subsidiary optionality (₹150-200 Cr value by FY28)
Implied Fair Value:
Base Case (18x P/E on FY27E EPS ₹45):₹810/share (+69% upside)
Bull Case (20x P/E on FY27E EPS ₹52):₹1,040/share (+117% upside)
Bear Case (14x P/E on FY27E EPS ₹38):₹532/share (+11% upside)
2. Analyst Coverage Gap
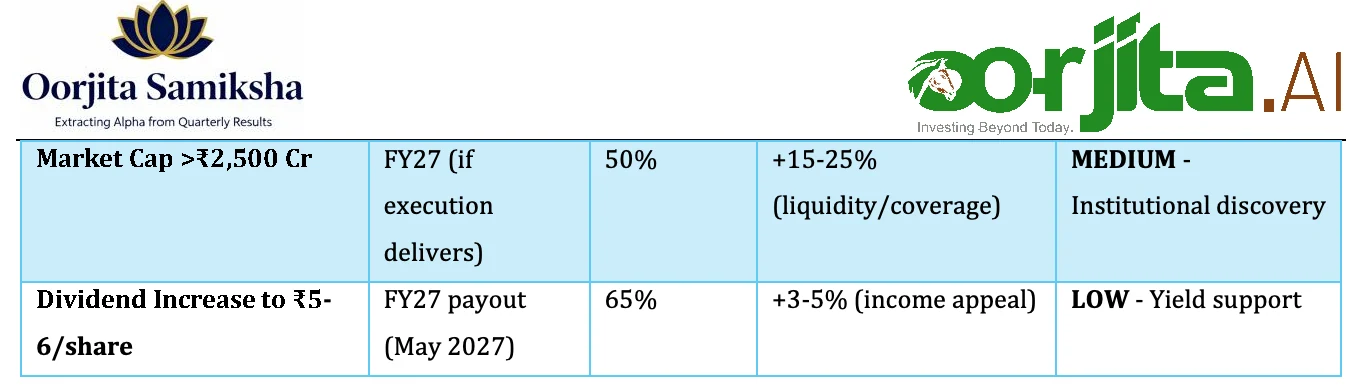
Current Coverage: Minimal - 2-3 small brokerages; no large institutional coverage Reason: Market cap ₹1,620 Cr below threshold for most brokers (require ₹2,500+ Cr)
Market Inefficiency:
No sell-side research = Less institutional awareness
CURRENT SHAREHOLDING PATTERN (September 2025 - Q2 FY26)
Category
Holding %
6-Month Change
Trend
Promoters
70.40%
0.00% (Flat)
Unchanged
FII (Foreign Institutions)
3.09%
-1.05% (Major Exit)
Declining
DII (Domestic Institutions)
0.47%
+0.00% (Stable)
Flat
Mutual Funds
0.00%
- (No Holding)
Absent
Retail & Others
26.03%
+1.04% (Accumulating)
Rising
9Investment Recommendation
PRIMARY RECOMMENDATION: HOLD (Upgrade to BUY on Q3 Execution)
Rating Methodology: Based on 18-24 month target price with >25% upside threshold for BUY rating. Target Price:₹620/share (Base Case: 17x FY27E EPS of ₹36) Current Price:₹480/share (estimated as of Nov 17, 2025) Upside Potential: 29% over 18-24 months (13-17% CAGR) Investment Horizon: 18-24 months (Medium-term tactical)
Execution Risk - Unit 2, Brazil, registrations all pending delivery
Net Assessment: HOLD with BUY-on-Dips mentality
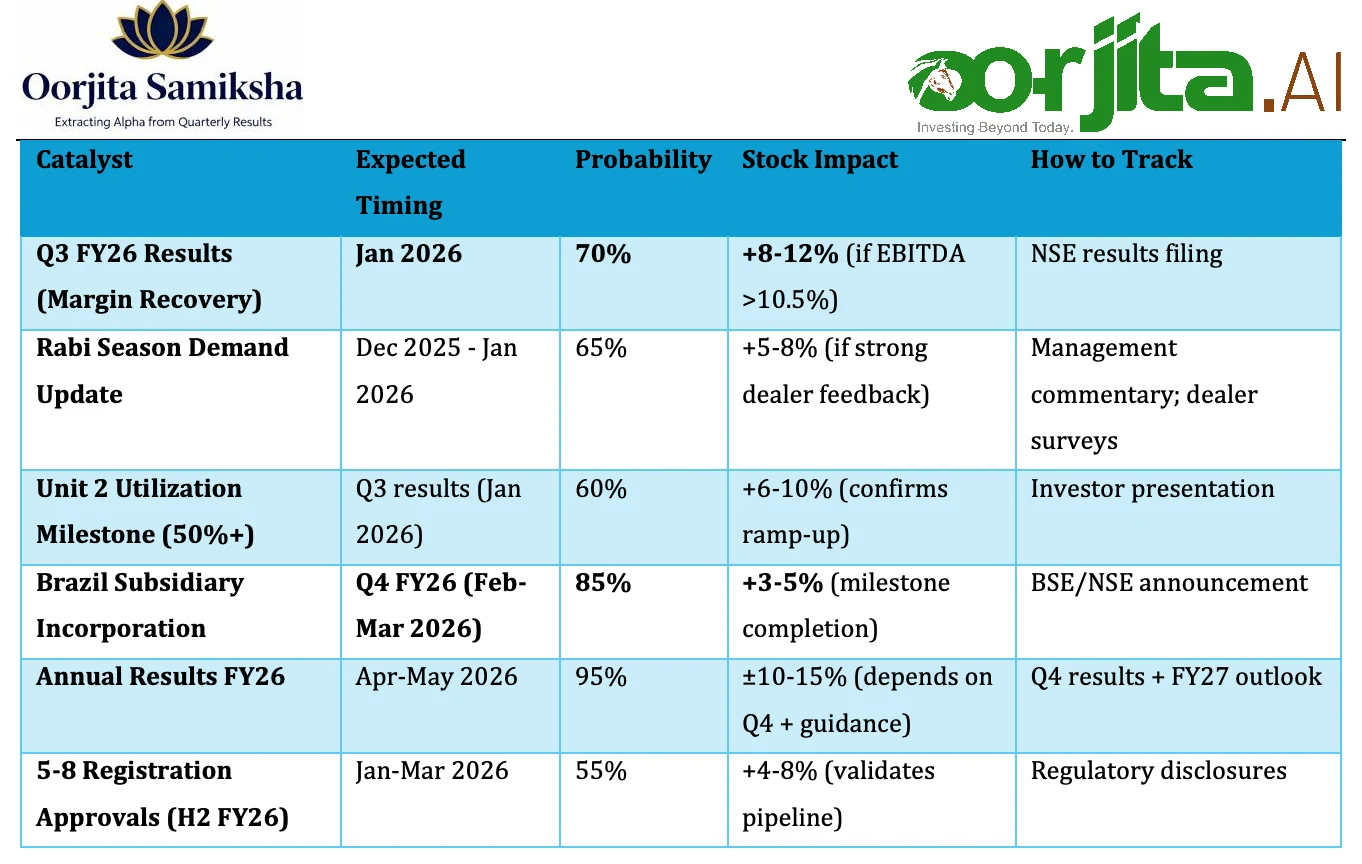
The combination of undervalued assets (Unit 2, Brazil, registrations) and near-term execution uncertainty (Q2 margin collapse) creates a "show-me" story. Q3 FY26 results (Jan 2026) are THE
inflection point:
If Q3 margin >10.5% + Unit 2 revenue >₹65 Cr → Upgrade to BUY; target ₹720
If Q3 margin <10% OR Unit 2 revenue <₹60 Cr → Downgrade to SELL; target ₹380Current Recommendation: HOLD at ₹480; accumulate on dips to ₹440-460; sell on breaks below ₹410.
Conclusion & Actionable Takeaways
One-Line Summary:
Dharmaj Crop Guard is a tactical HOLD for growth-oriented investors with 18-24 month horizon, offering 29% upside driven by Unit 2 ramp-up, Brazil subsidiary, and registration pipeline, but requiring Q3 FY26 margin recovery confirmation before upgrading to BUY.
Immediate Action Items:
For Existing Shareholders:
HOLD through Q3 FY26 results (Jan 2026); avoid panic selling on Q2 weakness
ADD 20-30% to position if stock dips to ₹440-460 (support zone)
Set price alerts at ₹560 (partial profit-taking) and ₹620 (full target)
Review position quarterly; exit if Q3 margin <10% (bear case confirmation)
For Prospective Buyers:
Small Entry (2-3% allocation) at current ₹480 if conviction-based
Wait for Q3 Results (Jan 2026) for better risk-reward; enter if margin >10.5%
Keep 50% dry powder for ₹440-460 dip (if Q3 underwhelms initially but not disastrous)
Set hard stop-loss at ₹410 (protect capital if bear case unfolds)
For Portfolio Managers:
Neutral Weight Indian agro via Dharmaj (not overweight given execution uncertainty)
Pair with UPL long (relative value trade; UPL has margin recovery momentum vs Dharmaj uncertainty)
Hedge with Nifty Smallcap Index puts (protect against mid-cap correction)
Monitor working capital trends (red flag if assets grow >revenue for 3 consecutive quarters)
www.oorjita.ai is not operated by a broker, a dealer, or a registered investment adviser. Under no circumstances does any information posted on www.oorjita.ai represent a recommendation to buy or sell a security. The information on this site, and in its related newsletters, is not intended to be, nor does it constitute investment advice or recommendations. The information on this site is in no way guaranteed for completeness, accuracy or in any other way. In no event shall Oorjita Fin AI Services be liable to any member, guest or third party for any damages of any kind arising out of the use of any content or other material published or available on www.oorjita.ai, or relating to the use of, or inability to use, www.oorjita.ai or any content, including, without limitation, any investment losses, lost profits, lost opportunity, special, incidental, indirect, consequential or punitive damages. Past performance is a poor indicator of future performance.