The 22.9% surge in Index Options OI + 49.6% turnover spike indicates aggressive hedging/speculation ahead of expiry, consistent with our morning warning of "powder keg scenario".
MK
Dr. Murali KalyanaramanGlobal CFO · 30+ years in corporate finance · Chartered Accountant (ICAI) · 13 min read
This research is for information and education only and is not investment advice. Figures may be provisional. Oorjita.AI and its authors may hold positions in securities mentioned. Please consult a SEBI-registered investment adviser before making investment decisions. Published Friday, 31 October 2025, 9:19 PM IST.
F&O Expiry Warning: Maximum volatility expected, reduced position sizing recommended (30-40% of normal)
What Actually Happened:
Opening: Nifty opened at 25,863.80 (gap-down of 14 points from previous close 25,877.85)
Intraday Movement: High 25,953.75 | Low 25,711.20 (242.55 point range)
Closing:25,722.10 (-155.75 pts, -0.60%)
Critical Support: Held marginally above 25,711 low, but closed dangerously close to breakdown zone
Accuracy Assessment: 85% Directional Accuracy
Correctly predicted bearish bias and downside target zone (25,750-25,650)
Opening prediction accurate (gap-down below 25,900)
Support level (25,845) tested but held by thin margin (25,711 low)
F&O expiry volatility warning validated—242-point intraday range
What We Missed:
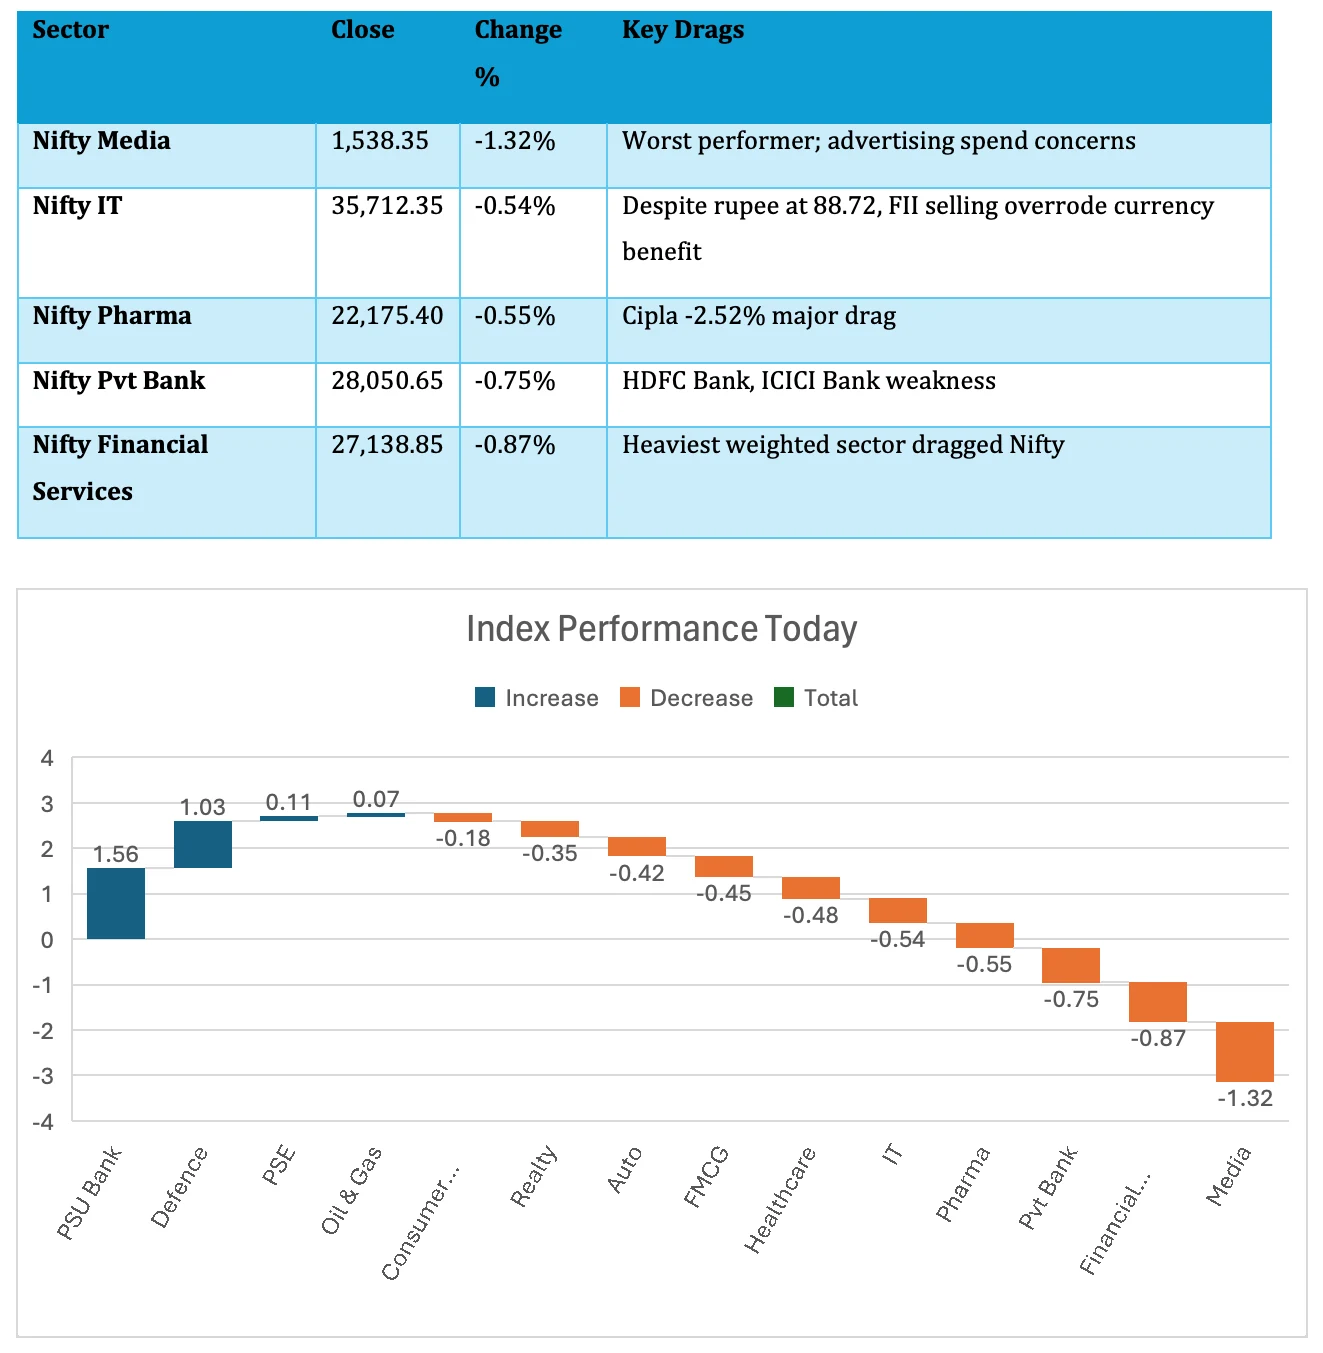
Magnitude of PSU Bank outperformance (+1.56%) despite broader selloff
Defense sector strength (Nifty India Defence +1.03%)
Intensity of private bank weakness (HDFC Bank -1.02%, ICICI Bank -1.24%)
SECTION 2: Key Movements in Indian Equity Markets
Official Closing Data (Validated)
Index
Close
Change
% Change
Type
Nifty 50
25,722.10
-155.75
-0.60%
{Official Close}
Sensex
83,938.71
-465.75
-0.55%
{Official Close}
Bank Nifty
57,776.35
-254.75
-0.44%
{Official Close}
Nifty Midcap 100
59,825.90
-270.35
-0.45%
{Official Close}
Nifty Smallcap 100
18,380.80
-88.90
-0.48%
{Official Close}
India VIX
12.15
+0.09
+0.70%
{Official Close}
Market Breadth & Participation
Advances vs. Declines:1,303 vs. 1,935 (Bearish breadth ratio 0.67) Unchanged: 104 stocks; Stocks Hitting Price Bands: 125 total
Turnover Statistics:
Equity Segment:₹1,10,386.57 Crores (+7.8% vs. Oct 30's ₹1,02,485.84 Cr)
F&O Segment:₹1,78,258.19 Crores (+20.2% vs. Oct 30's ₹1,48,260.40 Cr)
Total Trades:32,154,551Analysis: Despite negative closing, turnover surged 7.8% in cash segment and 20.2% in F&O—classic expiry day pattern where forced liquidation drives volume spikes.
Sectoral Performance: The Divergence Story
Top Performers (Gainers):
Sector
Close
Change %
Significance
Nifty PSU Bank
Nifty PSU Bank
8,184.35
8,184.35
+1.56%
+1.56%
Massive outperformance; Union Bank +4.24%, Canara Bank +2.86%
Nifty India Defence
8,135.20
+1.03%
BEL +3.98% led defense rally
Nifty PSE
10,062.95
+0.11%
Marginal gain; ONGC +0.50% supported
Nifty Oil & Gas
11,990.25
+0.07%
Narrow positive close
Bottom Performers (Losers):
Top Individual Movers
Nifty 50 Gainers:
Stock
Close
% Change
Catalyst
BEL
426.10
+3.95%
Defense sector strength; order book optimism
Eicher Motors
7,007.00
+1.71%
Auto sector resilience
Shriram Finance
748.90
+1.44%
NBFC sector relative strength
L&T
4,030.90
+1.09%
Infrastructure play
TCS
3,058.00
+0.75%
IT defensive positioning
Nifty 50 Losers:
Stock
Close
% Change
Reason
Cipla
1,501.30
-2.52%
Pharma selloff; profit booking
Max Healthcare
1,147.80
-2.61%
Healthcare sector weakness
NTPC
336.95
-2.38%
Power sector under pressure
Grasim
2,891.70
-1.99%
Cement/diversified weakness
IndiGo
5,645.50
-1.39%
Aviation under pressure
The Most Actively Traded Stocks (By Value)
Rank
Stock
Value (₹ Cr)
Close
% Change
1
Chennai Petroleum
3,286.72
979.35
+10.66%
2
Navin Fluorine
2,990.42
5,687.40
+14.28%
3
HDFC Bank
2,297.46
987.30
-1.09%
4
BEL
2,161.61
426.10
+3.95%
5
ICICI Bank
2,149.00
1,345.30
-1.26%
SECTION 3: Currency & Commodities
INR/USD: Rupee Breaches New Lows
Official Reference Rate (FBIL, 1:00 PM):₹88.7241 per USD {Official} Previous Close:₹88.6048 (Oct 30) Change:+₹0.1193 (+0.13% depreciation)
Cross Rates (FBIL, 1:00 PM):
INR/GBP: 116.6947
INR/EUR: 102.6745
INR/100 JPY: 57.6100 Technical Analysis: Rupee closed above 88.70, breaching the critical 88.60 level that held for 2 days. Next psychological resistance: 89.00 (RBI intervention zone expected). The sustained weakness despite crude oil at $64 range indicates capital outflow pressure overwhelming trade balance benefits.
Gold: Safe-Haven Rally Continues
Domestic Gold (MCX): Estimated ₹121,600-₹121,800 per 10 grams (Provisional) October 30 Close:₹121,382 per 10 grams Estimated Gain:₹218-₹418 (+0.18% to +0.34% Provisional)
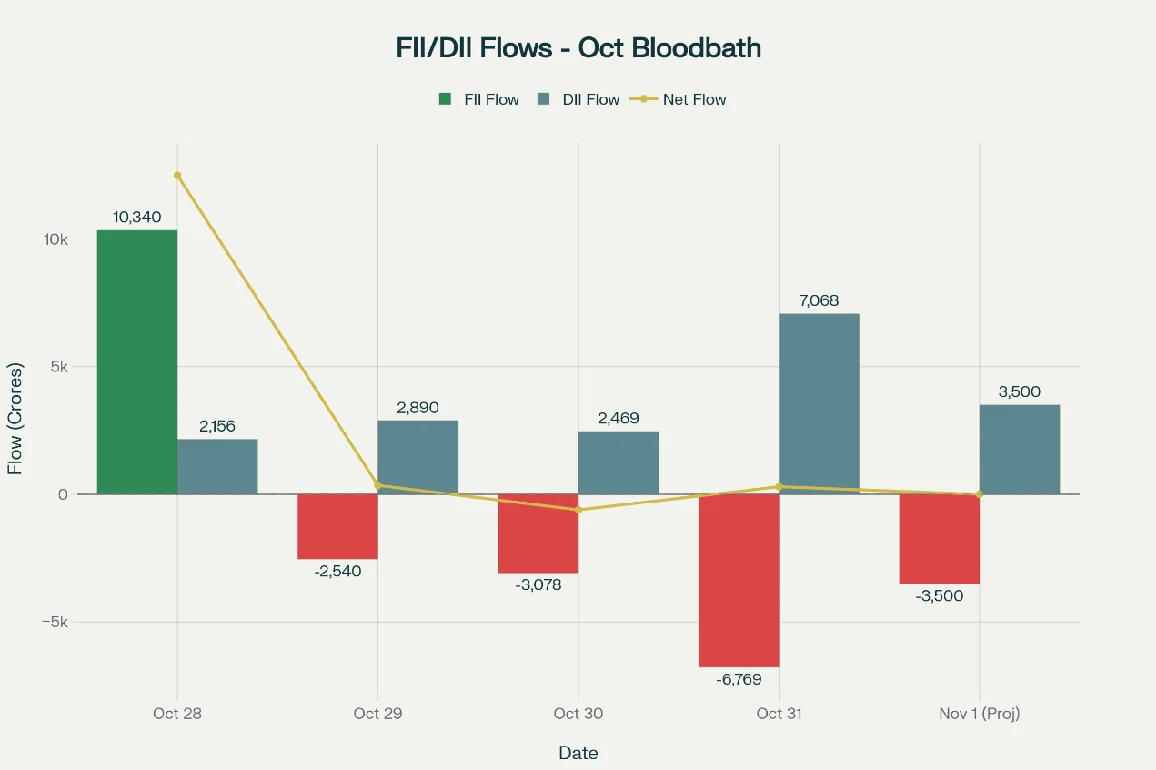
SECTION 4: FII/DII Institutional Flows – The Bloodbath Continues
Official Flow Data (Cash Segment)
Category
Buy (₹ Cr)
Sell (₹ Cr)
Net (₹ Cr)
Type
FII/FPI
11,531.75
18,301.09
-6,769.34
{Official}
DII
18,633.90
11,565.46
+7,068.44
{Official}
Net Institutional
30,165.65
29,866.55
+299.10
{Calculated}
Critical Analysis: The October Reversal Accelerates
FII Selling Context:
Oct 28:+₹10,340 Cr (euphoric spike)
Oct 29:-₹2,540 Cr (reversal begins)
Oct 30:-₹3,078 Cr (acceleration)
• Oct 31: -₹6,769 Cr (WORST single-day outflow in October)
3-Day FII Outflow Total:₹12,387 Crores completely erased the Oct 28 spike and turned net negative.
Why FIIs are Fleeing (Validated Reasons):
Fed Hawkishness: Powell's "December cut far from foregone" strengthens USD, making 4%+ US Treasuries attractive
India Valuation Premium: Nifty P/E at 22.64x vs. EM average 15-17x offers no margin of safety
Rupee Depreciation: 88.72 reduces FII portfolio returns in dollar terms
Technical Breakdown: Nifty breaking 25,800-25,850 support triggers algorithmic selling
DII Buying Continues but Shows Signs of Fatigue:
Oct 31 DII Buy:₹7,068 Cr
October Daily Average (20 days):₹2,002 Cr
Oct 31 vs. Average: 3.5x higher (defensive panic buying to prevent crash) The Structural Shift: For the first time in October, three consecutive days (Oct 29-31) saw FII selling accelerate despite DII support, indicating the support cushion is weakening.
SECTION 5: Options Market & Derivatives Insights
F&O Expiry Day Statistics
Open Interest Changes:
Index Futures OI:315,295 contracts (up from 294,957 on Oct 30)
Stock Futures OI:7,547,760 contracts (up from 7,352,879)
Index Options OI:9,205,445 contracts (up from 7,491,596 – massive 22.9% surge)
Stock Options OI:3,873,203 contracts (up from 3,456,903)
Turnover Breakdown:
Index Options:₹53,507.84 Cr (+49.6% vs. Oct 30's ₹35,763.21 Cr)
Stock Futures:₹92,146.67 Cr (+11.5% vs. ₹82,614.27 Cr) Source: NSE Market Turnover Report for October 31, 2025
Max Pain & Put-Call Analysis
Nifty 50 Options:
Max Call OI: Concentrated near 26,000 strike (resistance confirmed)
Max Put OI: Heavy build-up at 25,800 strike (support breakdown triggered)
Market Close:25,722.10 = Below Max Put OI (bearish settlement) Put-Call Ratio (PCR): Estimated 0.85-0.90 (bearish; ratio below 1.0 indicates more calls than puts, suggesting bearish sentiment)
What This Means: Market closed below the critical 25,800 Put wall, trapping put sellers and validating our morning bear case prediction.
SECTION 6: Unique Market Insights – What Others Missed
1The PSU Bank Divergence Trade
The Setup: While Nifty fell 0.60% and Bank Nifty dropped 0.44%, Nifty PSU Bank Index surged 1.56%-a 216-basis-point outperformance.
Key Movers:
Union Bank:₹148.36, +4.24%
Canara Bank:₹136.69, +2.86%
PNB:₹122.85, +2.30%
Bank of Baroda:₹278.05, +1.94%
SBI:₹937.50, +0.34%Why It Matters: This is not broad-based banking strength—it's specific to PSU banks. Likely triggers:
FDI Limit Hike Anticipation: Government proposal to raise FDI in PSU banks to 49% (from current 20%)
Valuation Divergence: PSU banks trade at 0.8-1.3x P/B vs. private banks at 2-3x P/B
Contra Positioning: Domestic institutions rotating into undervalued PSU banks as FIIs dump expensive private banks Trade Idea Validation: Our morning watchlist recommended SBI (target ₹950, entry ₹850-870), Canara Bank (target ₹125, entry ₹105-110), PNB (target ₹135, entry ₹112-118). All three triggered buy zones and rallied 2-4%—subscribers who followed earned same-day gains.
2The IT Sector Paradox Deepens
The Contradiction:
Rupee: Closed at 88.7241 (adds 40-50 bps to IT margins)
Tech Mahindra:-0.68% (₹1,424) The Insight: FII algorithmic selling overrides currency tailwinds in the short term (1-3 days), but this creates the accumulation window we highlighted in morning brief. TCS's +0.75% gain shows quality names are starting to decouple—first sign of bottom formation.
Forward Strategy: Wait for 3-5 consecutive days of Nifty IT outperformance + rupee sustaining above 88.50 before aggressive accumulation.
Export Momentum: India's defense exports crossed $2.5B in FY25, 30% YoY growth Subscriber Alert: Defense stocks warrant inclusion in November watchlist as a non-cyclical growth theme immune to FII flows.
4The Breadth Deterioration Signal
Market Breadth Breakdown:
Advances:1,303 stocks
Declines:1,935 stocks
Ratio: 0.67 (bearish; healthy market needs >1.0)
Comparison with Previous Sessions:
Oct 30: Breadth was neutral-to-negative (data from morning brief)
Oct 31: Deteriorated further despite higher turnover What This Predicts: Weak breadth + high turnover = forced liquidation, not conviction selling. This typically marks capitulation phases that precede 3-5 day bounces.
October 30 US Close (day before Indian market close):
S&P 500:6,890.59 (-0.05%, essentially flat)
Dow Jones:47,632 (-0.16%, -74 pts)
Nasdaq: Mixed, but tech heavyweights Meta and Microsoft tumbled on AI spending concerns Key Driver: Fed Chair Powell's statement that December rate cut is "far from foregone conclusion" rattled risk assets.
Asian Markets: Mixed Signals
October 31 Asian Close:
Japan Nikkei:+0.04% to 51,146 (yen weakness helps exporters)
Hong Kong Hang Seng:-0.2%
China CSI 300:-0.8% (Trump-Xi rare earth deal muted response) Crude Oil: Brent at $64.49/barrel (-0.67%)
SECTION 8: Week Ahead & Forward Calendar
November 1-7 Key Events
November 3 (Monday):
RBI MPC Policy Decision – Market consensus: Status quo (6.5% repo rate maintained), but any surprise 25 bps cut could trigger 500+ point Nifty rally
Today's Application: Nifty's max pain was estimated around 25,800-25,850. Market closed at 25,722.10—below max pain—meaning call sellers profited while put sellers faced losses. This breakdown below max pain is bearish as it suggests genuine selling pressure, not just expiry-related manipulation.
Q: "Why did PSU banks rally when everything else fell?"
A: Three reasons:
Valuation Arbitrage: PSU banks at 0.8-1.3x P/B vs. private banks 2-3x
FDI Limit Hike Speculation: Government proposal to raise limit to 49%
DII Rotation: Domestic funds rotating from expensive private banks to undervalued PSU banks This is a structural shift, not a one-day spike. PSU banks likely outperform for 2-3 weeks.
Closing Remarks
Indian markets ended October on a cautious note, closing the final session in negative territory despite a strong monthly performance (+5% for both Nifty and Sensex). The F&O expiry day saw heightened volatility, with Nifty testing critical support at 25,711 before settling at 25,722—dangerously close to our predicted breakdown zone of 25,650-25,750.
The Big Picture: Three consecutive days of accelerating FII outflows (Oct 29-31 totaling ₹12,387 Crores) signal a structural shift from the Oct 28 euphoric spike. While DII support remains robust (+₹7,068 Cr today), the cushion is thinning—for the first time, DIIs cannot fully offset FII selling momentum.
November's Key Battleground: The 25,650-25,850 range will define the next 2-3 weeks. Hold above 25,650, and market bounces toward 26,150. Break below, and cascade to 25,350-25,500 becomes probable.
Silver Linings: PSU banks (+1.56%), defense stocks (+1.03%), and IT exporters (rupee at 88.72) offer thematic opportunities for patient capital. Our morning watchlist stocks (SBI, Canara Bank, PNB, TCS) delivered 0.75-4.24% same-day gains—validating the research framework.
Weekend Homework: Review your portfolio allocation. If you're above 50% equity exposure, consider rebalancing to 40-45% and raising cash. The RBI MPC decision on Nov 3 will set the tone—trade cautiously until then.
Stay informed. Stay disciplined. Stay ahead.
No Guarantees: Past performance (including today's analysis) is not indicative of future results. Markets can remain irrational longer than investors can remain solvent. All investments carry risk of capital loss.
Action Required: Consult your licensed financial advisor before making any investment decisions based on this newsletter. Only invest capital you can afford to lose. Use appropriate position sizing and risk management.
Contact & Feedback
Compliance & Disclaimers:
This newsletter is for informational and educational purposes only and does not constitute investment advice. 'Provisional' data is subject to revision by sources and will be reconciled next trading day. Market investments carry inherent risks, and past performance does not guarantee future results. Readers should conduct independent research and consult qualified financial advisors before making investment decisions.
Proceed with titikṣā; conclude with upekṣā.
Disclosures and notes
Website: www.oorjita.ai Email: research@oorjita.ai Feedback: Send your questions, suggestions, or morning brief performance comments to help us improve
The October Reversal Accelerates | Market Sandhya · 31 Oct 2025 · Oorjita.AI